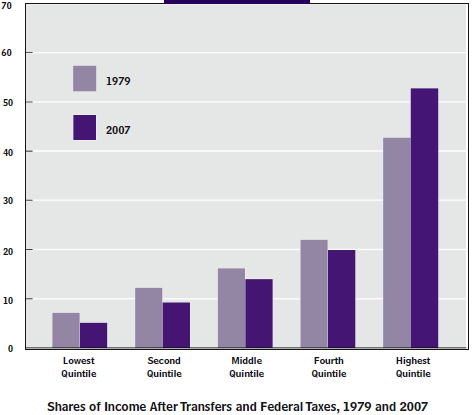
How bad is income inequality in the U.S. and what should be done about it? This is a question of great current interest with many different points of view. The chart just below from the Congressional Budget Office shows the extent of income inequality and also shows that it has gotten somewhat worse between 1979 and 2007, just before the onset of the Great Recession. And we know that our stagnant economy has made it worse yet between 2007 and the present.
 But now look at the chart (below) from the U.S. Census Bureau of the distribution of household income in the U.S. in 2012. The chart shows the median income of about $51,000 and then has a very long tail to the right. This means that there are large numbers of households making large incomes of all different sizes. It makes no particular sense to distinguish the top 1% (who make $380,000 or more) from the bottom 99%.
 The point is that there is huge opportunity in the U.S. to do very well financially whether or not one makes it into the top 1%.
In an earlier post, “Growth vs Equitable Growth,” I reported on the agenda of the Washington Center for Equitable Growth, a progressive think tank. In order to achieve “equitable growth” they advocate:
- Improving educational outcomes at all levels, pre-K – 12+.
- Running a “high pressure” economy in order to tighten the labor market.
- Expand the Earned Income Tax Credit especially for workers without children.
I couldn’t agree more. This is an excellent plan to create more prosperity for more people. It’s much more plausible in the U.S. to make poor people richer than to make rich people poorer.
