The Republicans are Making a Huge Mistake with the Current Tax Plan by Appearing to be Fiscally Irresponsible


The House and Senate have now each passed their own similar tax bills and a conference will come up with a single unified plan. Each of the individual bills has been scored to add $1 trillion to the national debt over a ten year period and so the final plan will almost surely have this same feature.
With our public (on which interest is paid) debt now 77% of GDP, the highest since right after WWII, and already growing rapidly, this is an extremely unattractive, and even dangerous, feature of the tax plan.
One of our most cherished principles in the U.S. is “liberty and justice for all.”  But consider the normally perceived philosophical differences between the two political parties:

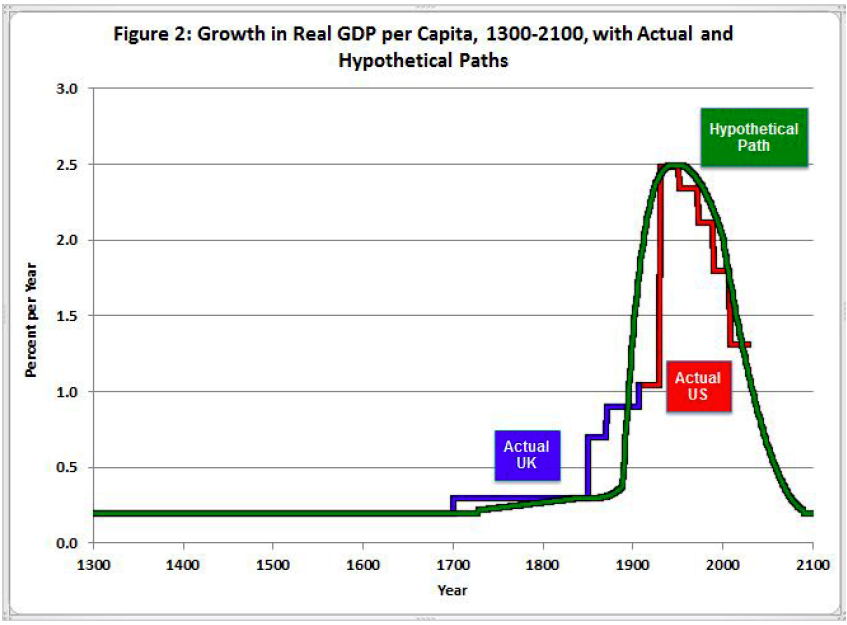
  • The Republicans are the party of liberty concentrating on providing maximum opportunity for people to succeed in life by realizing their full potential. This means fostering strong economic growth in order to have lots of opportunities for self-betterment. It also means keeping government at all levels as lean and efficient as possible, so as to minimize interference with private initiative. Excessive public debt is a particular anathema by creating a huge public burden, especially on future generations.

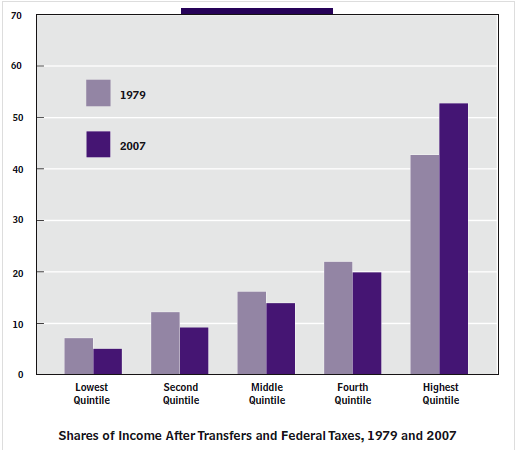
  • The Democrats are the party of justice concentrating on helping to provide the less fortunate members of society with the necessities of life by means of public support programs. This also means working to oppose all forms of prejudicial behavior based on race, gender, sexual orientation, etc. In addition it means trying to alleviate the inevitable income inequalities which arise in a free and dynamic society like ours, primarily with redistribution of tax revenues.

Conclusion. Both parties have fundamentally important principles. They gain and keep adherents by fighting for what they believe in. If the national Republican Party becomes lackadaisical about our huge national debt, as it appears to be right now, it risks losing its reputation for fiscal responsibility.  This will do it great damage.

Follow me on Twitter 
Follow me on Facebook 

U.S. Income Inequality and Household Demographics


Income inequality is a hot political issue today and I have frequently discussed it on this blog.  In particular, the chart just below shows that income inequality is only slightly worse since 1979, after government transfers and federal taxes are taken into account.


The AEI scholar, Mark Perry, has analyzed the 2016 annual report from the Census Bureau on “Income and Poverty in the United States” and points out the very strong correlation between income inequality and household demographics.


For example:

  • The mean number of earners per household increases steadily from a low of .43 in the lowest income households to 2.04 in the top income households.
  • The marital status of householders. The share of married-couple households is only 17.3% in the bottom income quintile and then increases steadily to 76.5% for the top income quintile.
  • The age of householders. In the lowest income quintile only 42.4% of households included individuals in the prime earning years of ages 35-64, while 69.9% of households in the top quintile include individuals in this group.
  • The work status of householders. Only 18% of the lowest earning quintile households included an adult who was working full time, as compared to 77.7% of top earning households.
  • The education of householders. Only 14.6% of lowest earning households had a family member with a college degree and this percentage rose steadily to 64% for top earning households.

Conclusion. Household demographics are very highly correlated with household income. Specifically, high-income households have a greater average number of income-earners than households in the lower-income quintiles.  Individuals in high-income quintiles are far more likely to be well-educated, married, working full-time and in their prime working years. It is also true that individuals and households can and do move up and down the income quintiles as these key demographic variables change.

Follow me on Twitter 
Follow me on Facebook 

The Origins of Trumpism III. The Upper Middle Class


Like everyone else, I am trying to understand how such a sleazy and personally obnoxious individual as Donald Trump was elected President of the United States. We know that his core supporters are white working-class voters.  We also know that our relatively stagnant 21st century economy has been very difficult on blue-collar workers.


But here is another thread.  The author, Richard Reeves, in the new book “Dream Hoarders” makes a strong case that the real inequality gap in the U.S. is not between the top 1% (the wealthy) and the bottom 99% but rather between the top 20% (the upper middle class) and the remaining 80%.
Consider:

  • The top 20% consists of households with an income above $112,000 per year (see chart). Such households saw a $4 trillion increase in incomes between 1979 and 2013. A third of this income rise went to the top 1%. But this still left $2.7 trillion for the next 19%. The lower 80% saw an income rise of $3 trillion over this same period.
  • The top 20% are the highly educated doctors, lawyers, business managers, academics, think tankers, journalists, etc. These are the people who flourish in a global economy, largely shielded from the intense market competition faced in the nonprofessional occupations.
  • Donald Trump tapped into the anxiety of the lower 80%. He received 58% of the total white vote but 67% of the votes of whites without a college degree.
  • The upper middle class tend to perpetuate their inherent advantages. They tend to have stable marriages and live in the best neighborhoods with the best public schools. They can afford to send their kids to the best colleges. Most of their kids will remain in the upper middle class.

Conclusion. Such a thriving and self-perpetuating upper middle class can cause severe resentment amongst the bottom 80% who have to work much harder to make ends meet. How should this very difficult problem of entrenched elitism be addressed?  Stay tuned!

Follow me on Twitter 
Follow me on Facebook 


The Origins of Trumpism


Everyone is trying to figure out what Donald Trump is all about and I am no exception. My last two posts, here and here, compare his positives and negatives and what he is doing well so far and also not so well.
The American Enterprise Institute’s political economist, Nicholas Eberstadt, has an article in the current issue of Commentary, “Our Miserable 21st Century,” describing very cogently the economic and social conditions which have led to the election of Donald Trump as President of the United States. Says Mr. Eberstadt:

  • The year 2000 marks a grim historical milestone for our nation. The warning lights have been flashing for 15 years and now these signals are impossible to ignore.
  • First of all, the estimated net worth of American households has more than doubled between 2000 and 2016, from $44 trillion to $88 trillion (see below).capture103
  • At the same time the recovery from the crash of 2008 has been singularly slow and weak. By late 2016 per capita output was just 4% higher than in late 2007. In effect the American economy has suffered something close to a lost decade (see below).capture104
  • Then there is the employment situation. Between 2000 and 2016 the work rate for Americans aged 20 and older declined by 4% from 66% to 62%. To put this in different words: if our nation’s work rate today were back up to its start-of-the-century highs, 10 million more Americans would currently have paying jobs (see below).capture105
  • Half of all prime working-age male labor-force dropouts (totaling 7 million men) take opioid medication on a daily basis, typically paid for by Medicaid. In fact, 53% of prime-age males not in the labor force are enrolled in Medicaid.
  • Of the entire un-working prime-age male Anglo population in 2013, 57% were collecting disability benefits.
  • Currently 17 million men in America have a felony conviction somewhere in there past. This amounts to one of every eight adult males in the country. It is difficult for felons to find work and therefore to become productive members of society.

Concludes Mr. Eberstadt, “The abstraction of inequality doesn’t matter a lot to ordinary Americans. The reality of economic insecurity does.  The Great American Escalator is broken – and it badly needs to be fixed.  With the election of 2016, Americans within the bubble (of affluence) finally learned that the 21st century has gotten off to a very bad start in America.  Welcome to the reality.  We have a lot of work to do together to turn this around.”

Follow me on Twitter
Follow me on Facebook


The Economic Damage Caused by Very Low Interest Rates


As is well known, the Federal Reserve’s main tool in responding to the Financial Crisis in 2007 – 2009 has been quantitative easing (to lower long term interest rates) and direct reduction of the Federal Funds Rate (to lower short term interest rates). These measures definitely limited the severity of the Great Recession resulting from the Financial Crisis.  But the recession ended in June 2009, more than seven years ago.
Capture37In the meantime the continuation of such low interest rates is having many detrimental effects such as:

  • Pension funds, both public and private, have become greatly underfunded,  creating crises especially for state and local governments with defined contribution plans.
  • Retirement plans for millions of seniors have been upset by erosion of savings.
  • Inequality has increased as affluent stock owners benefit from the rapid increase of asset prices as investors reach for yield.
  • An immense misallocation of capital towards bond issuers at the expense of small business is taking place.
  • Federal debt is soaring as low interest rates make it much easier for Congress to ignore large budget deficits.
  • The next recession, when it inevitably arrives, will leave the Fed in a bind. The only tools remaining are a new round of quantitative easing (additional bond purchases) and even lower (i.e. negative) interest rates.
  • The Fed’s dual mandate of low unemployment (currently 4.9%) and price stability (low inflation) is being met but is accompanied by anemic GDP growth averaging only 2% since the end of the Great Recession. Such slow economic growth is largely responsible for the populist revolt in the 2016 presidential race.

Conclusion. Monetary policy can only accomplish so much. It is critical for the Fed to wind down its $4.5 trillion balance sheet as its bond holdings mature and to keep raising short term interest rates.  This will force Congress to step up to the plate with the changes in fiscal policy which are needed to stimulate economic growth.

Follow me on Twitter
Follow me on Facebook

Rising Prosperity around the World


My last post responds to a reader who is pessimistic about the future of our country and in fact of the whole world.  He thinks that the environment is deteriorating, that rapid economic growth is unsustainable and that there is too much income inequality between high and low wage earners.
My response to him is to refer to the recent book, “The Rational Optimist: how prosperity evolves” by Matt Ridley.  Mr. Ridley persuasively argues that not only has the human race made huge strides in recent times but that this progress is intrinsic to evolved human nature and is likely to continue indefinitely:

  • Since 1800 the population of the world has multiplied six times, yet average life expectancy has more than doubled and real income has risen more than nine times.
  • Between 1955 and 2005, the average human on earth earned nearly three times as much money (adjusted for inflation), ate one-third more calories of food, and could expect to live one-third longer, all this while world population doubled.
  • The rich have got richer but the poor have done even better. For example, the Chinese are ten times as rich, one-third as fecund, and 28 years longer-lived than fifty years ago. (Also see the above chart).
    Capture31
  • The spread of IQ scores has been shrinking steadily – because the low scores have been catching up with the high ones. This is known as the Flynn effect.
  • The four most basic human needs – food, clothing, fuel and shelter – have grown markedly cheaper during the past two centuries.
  • The most notorious robber barons of the late 19th century: Cornelius Vanderbilt, John D. Rockefeller, and Andrew Carnegie, got rich by making things cheaper.
  • Exchange and specialization, not self-sufficiency, is the route to prosperity.

Conclusion. As long as human beings are free to engage in exchange (trade) and specialization (acquisition of skills), prosperity will continue to evolve and human life will become better and better.

Follow me on Twitter
Follow me on Facebook

The U.S. Middle Class Is Growing, Not Shrinking


One of the topics I discuss on this blog is income inequality (here, here, and here).  An interesting article in yesterday’s Wall Street Journal, “Upper Middle Class Sees Big Gains, Research Finds,” is highly pertinent to the inequality issue.
Capture1As can be seen in the above chart, the percentage of people in the middle class or above has greatly expanded between 1979 and 2014.  Furthermore, the basic research on this issue,by Stephen Rose at the Urban Institute, shows very clearly (in the chart below) what is happening: the higher is a family income, the faster it is increasing.
Capture3The best policy response to this phenomenon should be clear.  Rather than trying to decrease inequality with higher taxes on the wealthy, we should be trying to boost the less wealthy into higher income classes. The way to accomplish this is to:

  • Grow the economy faster with broad-based tax reform (lower tax rates paid for by shrinking deductions), immigration (guest worker) reform, (fair) trade expansion, and regulation reform (to help more small businesses get started). This will create more jobs and better paying jobs.
  • Improve education with early childhood education (to get minorities off to a better start in school), boosting high school graduation rates above the current 80% average (with better career and vocational education) and making college more affordable by putting more resources into community colleges and scholarships for low-income students.
  • Combat social inequality. The fraction of children with a single parent is the best predictor of upward economic mobility. The lower-income class marriage rate has dropped from 84% in 1960 to 48% in 2010. Policy should therefore focus on removing the marriage penalty in all government programs.

The basic forces of globalization and growing technology use are driving this societal change. The best way to respond is to enable more people to benefit from these basic trends.

Follow me on Twitter
Follow me on Facebook

Can the U.S. Economy Do Better? II. It Won’t Be Easy


In my last post, “Can the U.S. Economy Do Better?” I laid out the view of the Hoover Institution economist John Cochrane that a few basic changes such as deep tax reform, a thorough overhaul of social programs, more educational competition and regulatory simplification would go a long way towards perking up the economy.
Capture6The banker and financial analyst, Satyajit Das, presents a contrary point of view in, “The Age of Stagnation: Why Perpetual Growth is Unattainable.”  According to Mr. Das:

  • The Global Financial Crisis (GFC) was not part of the normal boom and bust cycle, but rather the collapse of the postwar economic expansion under the weight of four main factors: high debt levels, large global imbalances, excessive financialization and an unsound build-up of future entitlements.
  • The economy risks becoming trapped in a QE-forever cycle. A weak economy leads to expansionary fiscal measures and Quantitative Easing (QE). If the economy responds then interest rates will go up and lead to a debt crisis. If the economy does not respond, then there is pressure for additional stimuli.
  • The economist Robert Gordon predicts that the future U.S. growth rate, adjusted for six big headwinds (demographics, declining educational attainment, rising inequality, effects of globalization, environmental costs, and debt overhang) may only be .2%, well below the 2.1% growth rate of the past few years.
  • The GFC may signal the zenith of globalization. The U.S. could function successfully as a closed economy, with foreign trade making up only 15% of GDP. The European Union and China could also turn inward. The rise of autarky and nationalism is a dangerous cocktail.
  • Financialization drives inequality. QE and low interest rates encourages high-income households to increase investments and therefore boosts the stock market. The increasing cost of healthcare, higher education and childcare is a big burden on low-income households.
  • Financial repression is increasingly accompanied by political repression which engenders lack of trust which in turn drives political disengagement and social disorder.

Ouch, ouch, ouch! This is a very negative assessment of the U.S. economic and social scene today.  But I report the views of Mr. Das because they are reality based and need to be dealt with.

Follow me on Twitter
Follow me on Facebook

Surprise! It Is Progressives Who Drive Income Inequality


The economist Lawrence Lindsey has an Op Ed in yesterday’s Wall Street Journal  analyzing Census Bureau data here, and here showing that income inequality rose more under Bill Clinton than under Ronald Reagan.  It also has risen much more under Barack Obama than under George W. Bush.
Capture6Here is the explanation for this:

  • Cheap money is a boon to those who have access to it.
  • Bill Clinton, George W. Bush and Barack Obama all presided over bubble economies fueled by easy monetary policy. But the effects of the Bush housing bubble were more evenly distributed than for the Clinton stock market bubble or the Obama credit bubble.
  • In 1968 government transfer payments totaled $53 billion or roughly 7% of personal income. By 2014, these had climbed to $2.5 trillion or 17% of personal income. Despite the redistribution of a sixth of all income, inequality is far higher today than in 1968.
  • Two earner households have become the backbone of the American middle class.
  • When families with children making between $20,000 and $50,000 attempt to have a second earner go back to work, the effective tax rate on the extra earnings, including lost government benefits, is between 50% and 80%. This “working class trap” is increasing income inequality and keeping the income of these households lower than they would otherwise be.
  • During the first six years of the Obama presidency, the number of two-earner households declined, while the number of single-earner households rose by 2.6 million and the number of no-earner households rose by 5 million. In other words, two-thirds of the increase in the number of households under Obama is accounted for by households with no one working. This is the reason the middle class has shrunk and that inequality is increasing.
  • A recent Brookings Institution study shows that boosting the top tax rate from 39.6% today to 50%, and redistributing the additional $95 billion in tax revenue to the bottom 20% of wage earners would reverse only 20% of the increase in income inequality under Obama.

As Mr. Lindsey concludes, “Attacking the rich and running against inequality may be a sensible political strategy. But in the end the programs to implement this strategy make the problem worse.”

Follow me on Twitter: https://twitter.com/jack_heidel
Follow me on Facebook: https://www.facebook.com/jack.heidel.3

Why Economic Growth is Slowing Down


The two main themes on this website, “It Does Not Add Up,” are that the U.S. national debt is too high and that our economy is growing too slowly.  How can we shrink the debt (as a percentage of GDP) and how can we make the economy grow faster?  I make use of all sources of information which shed light on these two fundamental issues.
CaptureToday I briefly discuss the work of the Northwestern University Economist Robert Gordon, summarized in his new book, “The Rise and Fall of American Growth.”  His basic thesis, see the above chart, is that human civilization experienced essentially no economic growth up until about 1700, then slow growth occurred mainly in the UK and US up until about 1870 followed by explosive growth mainly in the US up until about 1970.  Since 1970 growth has slowed way down except for a brief spurt from 1994 – 2004.
According to Mr. Gordon, these growth periods were caused by Industrial Revolution #1 (steam, railroads), IR #2 (electricity, internal combustion, modern plumbing, communications, petroleum), and IR #3 (computers, internet, mobile phones), all of which led to productivity growth spurts which have by now largely run their course. Not only are we out of industrial revolutions but there are, in addition, stiff headwinds working against economic growth.  For example:

  • The First Headwind: Rising Inequality. Downward pressure on the wages of the bottom 90%. Increased inequality at the top. Educational outcomes strongly correlated with socio-economic status.
  • The Second Headwind: Education. Stagnation in high school graduation rates and poor performance on international tests measuring achievement. High debt levels for college graduates.
  • The Third Headwind: Demography. The labor participation rate has dropped form 66.0% in 2007 to 62.6% today, only half caused by baby boomer retirements.
  • The Fourth Headwind: Repaying debt. The public debt, on which interest is paid, is now 74% of GDP and is predicted by the CBO to steadily increase. This will inevitably lead to either higher taxes or slower growth in future transfer payments.
  • The Fifth Headwind: Social deterioration at the bottom of the income distribution. Increasing number of children are born out of wedlock for high school graduates and dropouts, much higher for blacks than for whites. For mothers aged 40, the percentage of children living with both biological parents declined from 94% in 1960 to 34% in 2010.
  • Other Headwinds. Globalization and Global warming.

Mr. Gordon makes a voluminous case for the slowing down of economic growth, the basic reasons why this is happening, and the social forces which are making it worse. Next: How should public policy respond to this huge challenge?

Follow me on Twitter: https://twitter.com/jack_heidel
Follow me on Facebook: https://www.facebook.com/jack.heidel.3