The Slow Growth Fiscal Trap We’re Now In.


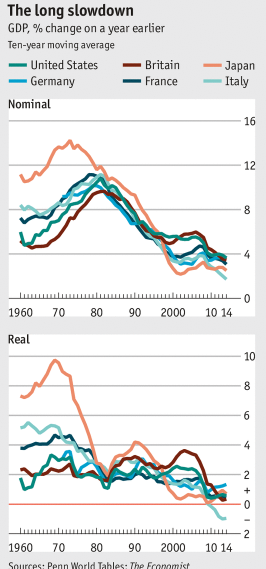
Our economy has been growing very slowly, about 2.2% per year on average, since the end of the Great Recession in June 2009.  The Congressional Budget Office predicts that this slow growth will continue indefinitely, although with a brief respite of 2.9%  growth in 2015 and 2016.  The American Enterprise Institute predicts an even lower, less than 2% growth rate, going forward.
CaptureHere’s the essence of the overall problem:

  • Slow growth keeps the unemployment level high and also means minimal raises for employed workers  The resulting economic slack leads to
  • Low Inflation. But low inflation in turn means that the Federal Reserve can try to increase growth with quantitative easing and at the same time maintain
  • Low Interest Rates to encourage borrowing. But an unfortunate side effect of low interest rates is that Congress can borrow at will and run up huge deficits without having to worry about paying interest on this “free” money. This leads to:
  • Massive Debt. But what is going to happen when inflation does take off which is bound to happen eventually? Then the Fed will be forced to raise interest rates quickly and we will be stuck with huge interest payments on our accumulated debt. When this happens, interest payments plus ever growing entitlement spending will eat up most, if not all, of the federal budget. This will almost inevitably lead to a severe
  • Fiscal Crisis.

                                                    FLOW CHART

  Slow Growth->Low Inflation->Low Interest Rates->Massive Debt->Fiscal Crisis

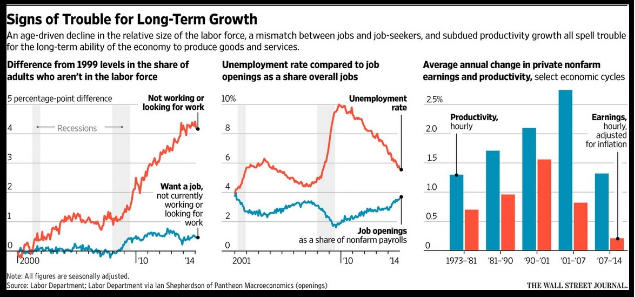
Of course, there are alternative scenarios.  Congress might become more responsible and cut spending and/or raise taxes.  We might luck out, so to speak, with such prolonged slow growth that inflation stays low indefinitely and interest rates never increase.  But slow growth is not pain free.  There are 20 million unemployed or under-employed Americans who want to work and whose lives are much less satisfying as a result of being idle.
Isn’t it obvious that the best response to this slow growth fiscal trap is to adopt policies to make the economy grow faster?  There are lots of things that could be done, many of which I addressed in my last post (https://itdoesnotaddup.com/2015/03/01/will-middle-class-economics-lift-us-out-of-secular-stagnation/) so I won’t repeat them here.  But I’ll be coming back to them again and again in the future!

Will ‘Middle Class Economics’ Lift Us Out of ‘Secular Stagnation’?


‘Secular Stagnation’ is the expression, made popular by the economist Larry Summers,  to refer to the present time period, since the end of the Great Recession, with slow economic growth, high unemployment, stagnant middle-class wages and increasing inequality.  It is to be contrasted with ‘The Great Moderation,’ from 1982 – 2007, with a rapidly growing economy, rising wages and stable prices.
CaptureMy last post, “Does ‘Middle Class Economics’ Really Work,” discusses President Obama’s attempt to appeal to middle-class families with policies such as:

  • Tax and regulatory provisions such as tax credits for childcare, college tuition, and second earners in two parent households; also requiring paid sick leave and a higher minimum wage.
  • Expanding access to community colleges to make workers more productive.
  • Increased infrastructure spending to boost employment.

The problem with this strategy is that it is much too weak to combat the huge headwinds opposing it.  In addition to the well-known effects of globalization and technological advance, consider the demographical challenge described below:

OECD old age support ratio:  the number of workers aged 20-64 relative to those aged over 65
Capture1
As is very clear from this chart, the demographics are just going to keep getting worse and worse and will be very bad indeed by 2050.
Here is a surprising quote from Mr. Summers: “To achieve growth of even 2 percent over the next decade, active support for demand will be necessary but not sufficient.  Structural reform is essential to increase the productivity of both workers and capital, and to increase growth in the number of people able and willing to work productively.  Infrastructure reform, policies to promote family-friendly work, support for exploitation of energy resources, and business tax reform become ever more important policy imperatives.”
I would add several additional policy changes which would speed up change in this direction:

  • Reform (but not repeal!) the Affordable Care Act by eliminating all mandates. This would incentivize businesses to move part-time employees to full time. Tax credits and subsidies provide enough incentive for individuals to become insured.
  • Regulatory reform to make it easier to start a new business.
  • Raise the age limits for both Social Security and Medicare to encourage people to work longer.
  • Reform disability insurance to make it more difficult to be declared disabled.
  • Tighten up welfare requirements to require all able-bodied adult recipients without dependents to work.
  • Reform immigration with guest-worker visas for needed foreign workers.

We need to get serious about boosting our labor participation rate in order to grow the economy faster.  Happy talk about ‘middle class economics’ will simply not do the trick!

Does ‘Middle Class Economics’ Really Work?


An article in yesterday’s Wall Street Journal, “What Clever Robots Mean for Jobs,”  illustrates the stark fact that “automation is commandeering much middle-class work such as clerk and bookkeeper, while creating jobs at the high- and low-end of the market.  This is one reason the labor market has polarized and wages have stagnated over the past 15 years.”
CaptureThe above chart shows the divergence between productivity growth and payrolls beginning in the year 2000.  It is a vivid portrayal of the “hollowing out” of the middle class which is causing so much grief.
Now let’s turn to a column in today’s New York Times, “What Is Middle-Class Economics,” by the journalist, Josh Barro.  The term, of course, refers to the policies by which President Obama hopes to appeal to the millions of middle-class families with stagnant incomes. According to Mr. Barro, the President’s policy proposals have three facets:

  • Tax and regulatory provisions such as tax credits for childcare, college tuition and a second earner in households where both parents work. Employers would be required to provide paid sick leave and the minimum wage would be raised.
  • Make workers more productive by expanding access to community college.
  • Increase overall economic growth with increased infrastructure spending and new trade agreements.

The problem, as Mr. Barro points out, is that such policies would have only a small effect on the taxes of a middle-income family, amounting to a cut of no more than $150 per year on average.  This is much less than the average family will save from falling gasoline prices.
On the other hand, it is generally understood that stagnant middle-class wages will not rise very much until the labor market becomes tighter as a result of falling unemployment.  Mr. Barro suggests that the government can help this process along in two ways:

  • By the Federal Reserve holding down interest rates, or at least letting them increase only very slowly.
  • With policies to make it easier to work less. The Affordable Care Act does this by decoupling health insurance from full time work. The surge in disability insurance recipients takes people out of the labor market. The rapid retirement of baby-boomers does the same thing.

Unfortunately there are many negative effects from both the Federal Reserve’s easy money policy as well as a shrinking labor participation rate.  I will return to this issue soon!

How Do We Speed Up Economic Growth?


The 2015 Economic Report of the President has just been released.  It shows that the slow growth of productivity is playing a bigger role in squeezing middle class incomes than the rise of economic inequality.
CaptureThe above chart makes some dire predictions:

  • The labor force, which has averaged 1.5% growth since 1950, is likely to grow just .5% a year in coming decades, because any increase in new workers is likely to be swamped out by baby-boomer retirements.
  • Productivity has grown just 1.3% a year since the end of the last expansion in 2007.
  • These two figures together predict an anemic, less than 2% growth, economy going forward.

The President proposes several policies to address this slow growth:

    • Immigration Reform would provide more highly skilled workers for the economy as well as a more efficient guest worker system for low-income labor.
    • Increased Foreign Trade would expand our export economy.
    • An Expanded Workforce could be achieved with a higher Earned Income Tax Credit to boost dual-income households.
    • An increase of Infrastructure spending of 1% of GDP is estimated to boost output by 2.8% after 10 years.
    • Corporate Tax Reform would encourage U.S. multinationals to bring their foreign profits home for reinvestment.

These are good ideas but much more could be done as well:

  • Individual Income Tax Reform, exchanging lower tax rates for all by closing loopholes and deductions would boost spending by middle- and lower-income tax payers.
  • Reforming Social Security and Medicare by setting higher retirement ages would encourage longer work lives.
  • Reforming the Affordable Care Act by removing the employer mandate would boost productivity by making the labor market more efficient.

Faster economic growth will not only reduce unemployment, it will also make it much easier to shrink the deficit as more tax revenue is raised.  This should be one of the very highest priorities for our elected representatives in Washington!

The Financial Crisis IV. Where Do We Go From Here?


“It was a great mistake to push lower-income people into housing they couldn’t afford and couldn’t really handle once they had it.                                                                    former Congressman Barney Frank, 2010

“Only by understanding the factors that led to and amplified the crisis can we hope to guard against a repetition.”
                                                   former Federal Reserve Chair, Ben Bernanke, 2010

As I explained in my last post, my views on the financial crisis are most heavily influenced by John Allison, President of the CATO Institute; Sheila Bair, former Chair of the FDIC; and Peter Wallison, a financial policy analyst at the AEI, as follows:

  • The primary cause of the crisis was the affordable housing policy, created by Congress and administered by HUD, under which higher and higher percentages of mortgages acquired by the GSEs Fannie Mae and Freddie Mac had to be made to low and moderate income borrowers. This policy, aided by the very low interest rates maintained by the FED from 2002-2004, created the housing bubble which burst in 2007 leading to an unprecedented number of delinquencies and defaults.
  • Subprime lending abuses could have been avoided if the FED had used the authority it had under the Home Ownership Equity Protection Act of 1994 to require appropriate mortgage lending standards. In other words, lax regulation, but not deregulation, was a major contributor to the crisis.
  • Investment Banks, such as Bear Stearns and Lehman Brothers, magnified the misallocation of credit to the housing market with financial products such as CDOs and derivatives.

Clearly congressional action was needed to address the financial abuses leading up to the crisis.  But the Dodd-Frank Act is an overreaction.  It requires 398 new regulations which are taking a big toll on the economy as shown by the chart below from the American Action Forum.
CaptureDodd-Frank should be scaled back so that its provisions apply only to the very largest financial institutions where the abuses were the greatest.  This can be accomplished with capital requirements which increase proportionally with the size of the institution so that smaller banks are better able to compete with the giants.
Faster economic growth is critical for our future.  It will not only create more jobs and higher paying jobs but will also alleviate our deficit problem by bringing in more tax revenue.  Paring back and streamlining Dodd-Frank would be a big step in the right direction.

The Financial Crisis III. How Do We Sort Out What Happened?


The Financial Crisis in 2008 was one of the most disruptive events in U.S. history.  It is crucial that we understand what caused it so that we can recover from it more fully and avoid a recurrence.  My favorite books about the crisis are: The Financial Crisis and the Free Market Cure by John Allison, President of the CATO Institute and former CEO of the large financial services company, BB&T;  Bull By the Horns by Sheila Bair, Chair of the FDIC from 2006-2011; and Hidden in Plain Sight by Peter Wallison, an economics policy scholar at AEI and former member of the FCIC.
CaptureNot surprisingly, these three very well informed individuals have somewhat different points of view.
Mr. Wallison says that the government’s affordable housing policies caused the financial crisis by essentially requiring the GSEs Fannie Mae and Freddie Mac to acquire increasingly large numbers of subprime mortgages.  The financial power of the GSEs forced private lenders to lower their own lending standards in order to compete (this last assertion is in dispute). When the resulting housing bubble burst, large numbers of subprime mortgages defaulted causing huge losses for both GSEs and private financial institutions alike.
Ms. Bair says that “the subprime lending abuses could have been avoided if the Federal Reserve Board had simply used the authority it had since 1994 under the Home Ownership Equity Protection Act to promulgate mortgage lending standards across the board.”  In March 2007 she testified strongly in favor of the Fed issuing an anti-predatory lending regulation under HOEPA and was rebuffed by the Fed.  As FDIC Chair she constantly urged, largely without success, that other federal agencies use their regulatory powers to curtail the abuses of private lenders.
Mr. Allison agrees with Mr. Wallison that “the whole origination market relaxed its standards to compete with Freddie and Fannie.”  However he goes on to say that “the investment banks (including Bear Stearns and Lehman Brothers) magnified the misallocation of credit to the housing market.  They created a series of financial innovations (CDOs, derivatives, etc.) that leveraged an already overleveraged product. … Investment bankers unquestionably made irrational decisions based on pragmatic, short-term thinking. … Those who made these mistakes should have been fired and their companies allowed to fail.”
Can these disparate points of view be melded into a coherent framework for the financial crisis which suggests a way forward from where we are today?  I will attempt to do this in my next post.

The Financial Crisis II. Is Peter Wallison Credible?


“It was a great mistake to push lower-income people into housing they couldn’t afford and couldn’t really handle once they had it.
 
                                                             former Congressman Barney Frank, 2010

“The ferocity of the left in defending Fannie Mae, Freddie Mac, and the government’s housing policies before 2008 is sometimes shocking, especially when even Barney Frank has given up.  It makes you wonder why this is so important to them.  They have no data, no policy arguments, just a virulent denial that anything other than the private financial sector could possibly be responsible for the financial crisis.”
                                                  “Hidden in Plain Sight,” p 42, by Peter Wallison, 2015

My last post, “The Financial Crisis I. The Cause” reported on a new book “Hidden in Plain Sight: What Really Caused the World’s Worst Financial Crisis and Why It Could Happen Again” by Peter Wallison, a financial policy analyst at the American Enterprise Institute.  He makes a very strong case, with voluminous documentation, that the basic cause of the financial crisis was the HUD policy requiring government agencies like Fannie Mae, Freddie Mac and the FHA to gradually acquire an increasing percentage of subprime mortgages.  When the housing bubble finally burst in 2007, the enormous number of delinquencies and defaults among these nontraditional mortgages, aggregate value over $5 trillion, drove down housing prices and caused the financial crisis.
CaptureAs noted above by Mr. Wallison himself, such an explanation is simply unacceptable to people who insist on blaming the private sector for the crisis.  Rather than dealing with public records and data available, they instead try to discredit Mr. Wallison.  My purpose today is to give two vivid examples of the types of documents which Mr. Wallison uses to make his case:

  • (Fannie Mae 10-K report, 2006). “We have made, and continue to make, significant adjustments to our mortgage loan sourcing and purchase strategies in an effort to meet HUD’s increased hosing goals and new subgoals.  These strategies include entering into some purchase and securitization transactions with lower expected economic returns than our typical transactions.  We have also relaxed some of our underwriting criteria to obtain goals-qualifying mortgage loans and increased our investments in higher-risk mortgage loan products that are more likely to serve the borrowers targeted by HUD’s goals and subgoals, which could increase our credit losses.
  • (statement by Daniel Mudd, former Fannie Mae CEO, April 2010). “Fannie Mae’s mission regulator, HUD, imposed ever-higher housing goals that were very difficult to meet during my tenure as CEO.  The HUD goals greatly impacted Fannie Mae’s business, as a great deal of time, resources, energy and personnel were dedicated to finding ways to meet these goals.  HUD increased the goals aggressively over time to the point where they exceeded the 50% mark, requiring Fannie Mae to place greater emphasis on purchasing loans in underserved areas.  This became particularly problematic when goal requirements grew to far exceed the proportion of eligible mortgages originated in the primary market.”

Mr. Wallison’s book is filled with this type of detailed documentation for the case he is making.  It should be persuasive to anyone with an open mind.  It certainly is to me.  Now that Mr. Wallison’s credibility is established, it is time to discuss the implications of his thesis.  Stay tuned!

The Financial Crisis I. The Cause


Only by understanding the factors that led to and amplified the crisis can we hope to guard against a repetition.                                                                                                         Ben Bernanke, September 2, 2010

An outstanding new book by Peter Wallison, ”Hidden in Plain Sight: What Really Caused the World’s Worst Financial Crisis and Why It Could Happen Again” gives a voluminous and highly compelling explanation of the main cause of the financial crisis of 2008.  Mr. Wallison worked at the Treasury Department in the 1980s, was a member of the Financial Crisis Inquiry Commission (2009 – 2011) and is currently a scholar at the American Enterprise Institute.
CaptureHere is the outline of Mr. Wallison’s story:

  • The Department of Housing and Urban Development gradually increased the requirement that loans acquired by Fannie Mae and Freddie Mac be made to low- and moderate-income borrowers from 30% in 1992 to 56% in 2008.
  • As a result of these policies, by the middle of 2008 there were 31 million Nontraditional (low down payment and/or poor credit) Mortgages (NTMs) in the U.S. Financial system, more than half of all mortgages outstanding, with an aggregate value of more than $5 trillion. At least 76% of these were on the books of government agencies such as Fannie, Freddie and the FHA or banks and S&L institutions, holding loans which they were required to make by the Community Reinvestment Act.
  • The 24 million NTMs acquired or guaranteed by government agencies were major contributors to the growth of the housing bubble and its lengthy extension in time.
  • The growth of the bubble suppressed the losses that would ordinarily have brought NTM type Private Mortgage-Backed Securities (PMBS) to a halt but rather made these instruments look like good investments.
  • When the bubble finally burst, the unprecedented number of delinquencies and defaults among NTMs drove down housing prices.
  • Falling home prices produced losses on mortgages, whether they were government backed or PMBS.
  • Losses on mortgages caused investors to flee the PMBS market, reducing the liquidity of the financial institutions that held the PMBS.
  • Once the housing bubble burst, four major errors were made by our top government financial officials: The first and major error was the rescue of Bear Stearns. The moral hazard created by this action reduced the incentive for other firms to restore their capital positions. Once Bear had been rescued it was essential to rescue Lehman Brothers. Treasury Secretary Paulson and Fed Chairman Bernanke’s arguing that they did not have legal authority to rescue Lehman provided an excuse for Congress to pass the destructive Dodd-Frank Act. Finally, TARP accomplished little but caused much popular resentment against the banks which supposedly got bailed out.

Conclusion: as long as the American people don’t understand that government housing policies were the main cause of the financial crisis, we are likely to repeat the same mistakes over again.

Is the Democratic Party Giving Up On Growth?


Prospects for future economic growth are decidedly grim.  The Congressional Budget Office has just reported that after a brief improvement for a couple of years, annual GDP growth will likely hover around 2.2% for the remainder of the ten year window 2015 – 2025.  This means, in turn, that the unemployment rate will also not likely fall much below its current level of 5.7% for the same ten year period.
CaptureA new report from the McKinsey Global Institute makes the even gloomier prediction that average U.S. GDP growth rate for the next 50 years will be only 1.9% per year, given current trends and policies.  A summary of this report is provided by the Brookings Institution social economist, William Galston.
On the other hand, according to New York Times columnist, Nate Cohn, the Democratic Party may be adopting a new policy direction, “The Parent Agenda, The Democrats’ New Focus.”  By this new focus he means:

  • Paid family leave
  • Universal preschool
  • An expanded earned-income tax credit and child tax credit
  • Free community college
  • Free four year college in time

Mr. Cohn points out that both President Obama as well as Hillary Clinton have endorsed such ideas.  Initiatives such as these are unlikely to go far in the current Republican Congress but they may still sound very attractive to the many hard-pressed middle class families with stagnant incomes.
The problem is that to emphasize a “family” political agenda like this is in effect to accept the conventional wisdom that faster economic growth is unattainable.  This is a defeatist attitude which is very harmful to the 20 million Americans who are either unemployed or under-employed. Here, briefly, is what could be done to boost economic growth in the short term:

  • Implement broad-based tax reform with lower tax rates for all, paid for by closing loopholes and limiting deductions.
  • Reduce regulatory burdens on business by, for example, streamlining (not repealing!) the Affordable Care Act and the Dodd-Frank Financial Reform Act.
  • Expand legal immigration with additional high-skill visas as well as an adequate guest worker program.
  • Expand international trade with new trade agreements.

These are all political footballs, of course, but also policies with much potential to speed up economic growth.  Either we take initiatives such as these or we consign our country to a future of relative economic stagnation with slow wage growth, high unemployment and increasing income inequality.

The Bush Deficits vs the Obama Deficits


As I like to remind readers, I am a fiscal conservative and a social moderate.  I started writing this blog in November 2012, after running unsuccessfully in a Republican congressional primary in May of that year.  I am appalled by our reckless fiscal policies in recent years.  We simply have to get federal spending in much better alignment with tax revenue and do this in a relatively short period of time.
Both political parties are responsible for our current predicament.  Nevertheless, we need to have the best factual information available to help us get back on track.  Today I compare the Bush deficits with the Obama deficits.  The most objective way to do this, in my opinion, is to divide the transition budget years, 2001 and 2009, between the incoming and outgoing presidents.  In other words, October, November and December of the year 2000 are assigned to President Clinton and the last nine months of the 2001 budget year, i.e. January 2001 – September 2001, are assigned to President Bush.  Likewise for the 2009 budget year, when Bush was leaving office and President Obama was coming in.
CaptureA good source for such detailed budget information is the website of David Manuel, “an online repository of financial and political information that is often searched for but is generally hard to find.”
Here is what I’ve come up with:

President Bush

  • 2001 budget year (last 9 months)                $129.6 (billion) surplus
  • 2002 budget year                                         $157.8 (billion) deficit
  • 2003 budget year                                         $377.6 (billion) deficit
  • 2004 budget year                                         $413   (billion) deficit
  • 2005 budget year                                         $318   (billion) deficit
  • 2006 budget year                                         $248   (billion) deficit
  • 2007 budget year                                         $161   (billion) deficit
  • 2008 budget year                                         $459   (billion) deficit
  • 2009 budget year (first 3 months)                $332.5 (billion) deficit
  •                                                                   $2,337.3 (billion) deficit TOTAL

President Obama

  • 2009 budget year (last 9 months)               $1080.5 (billion) deficit
  • 2010 budget year                                        $1294  (billion) deficit
  • 2011 budget year                                        $1299  (billion) deficit
  • 2012 budget year                                        $1100  (billion) deficit
  • 2013 budget year                                         $ 683  (billion) deficit
  • 2014 budget year                                         $ 483   (billion) deficit
  • 2015 budget year (CBO estimate)               $ 468   (billion) deficit
  • 2016 budget year (CBO estimate)               $ 467   (billion) deficit
  • 2017 budget year (first 3 months, CBO)      $ 163     (billion) deficit
  •                                                                   $7,037.5   (billion) deficit TOTAL  

These totals represent, of course, the amounts that were added (Bush) or will be added (Obama) to the national debt during their terms of office.  George Bush made little, if any, effort to control deficit spending.  But the Obama debt is three times as bad as the Bush debt.  Getting the debt under control is by far our biggest and most urgent national problem.  By failing to take our debt seriously, both Bush and Obama have been huge failures as president!