Should We Be Optimistic or Pessimistic about Our Country’s Future?

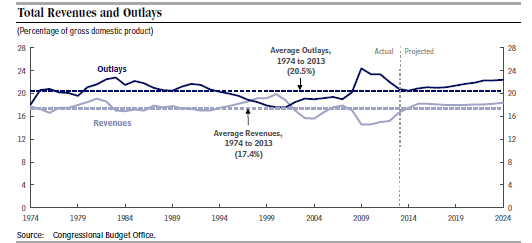
Last month the Congressional Budget Office issued the report “The Budget and Economic Outlook: 2014 to 2024”, giving an updated prediction on economic performance.  It predicts continued slow growth of GDP leveling off in the next few years at a rate of about 2.2% per year.  The public debt (on which we pay interest) will be 74% of GDP this year and increase to 79% of GDP by 2024.  Federal revenues will grow this year to 17.5% of GDP while federal spending will be 20.5% of GDP.  The problem is that the gap between revenue and spending will get worse as indicated by the chart below.
CaptureCBO estimates that interest rates on three month Treasury bills will rise from 0.1% today to 3.7% in 2018, and higher in subsequent years, which means that interest payments on our public debt will increase dramatically as shown in the chart below.  Inflation is predicted to average about 2% over this time period.  Unemployment will slowly drop to 5.8% in 2017 and not reach 5.5% until 2024.
Capture1In an article two days ago, an economics reporter for the New York Times, Floyd Norris, writes that this is “A Dire Economic Forecast Based on New Assumptions”.  Mr. Floyd argues that it is unlikely that we will continue to have both anemic growth and high interest rates at the same time.  Of course, if the economy does grow more quickly, then government revenues will also grow faster which will slow down the growth of the debt.  But CBO predicts that our recovery from the Great Recession will continue to be tortuously slow.
The problem is that when interest rates do go up, as they will sooner or later, interest payment on the national debt will rise quickly, as shown in the CBO chart.  This is going to happen and will be unpleasant to deal with.  Are we going to have slow growth in the meantime, with high unemployment along with it, and then also have expensive debt payment later?  This is indeed a pessimistic prospect!
We have a continuum of choices:

  • Do nothing until the big crunch hits in a few years (like Greece)
  • Cut spending dramatically, including for entitlements (politically infeasible)
  • Raise taxes dramatically (also politically infeasible)
  • Both cut spending and raise taxes (perhaps doable as we get closer to the big crunch)
  • Grow the economy faster which would both lower unemployment and raise revenue

I know what my choice is, how about you?

A Breath of Fresh Air


U.S. Representative David Camp (R, Michigan), Chair of the House Committee on Ways and Means, has just introduced the “Tax Reform Act of 2014” and describes it in a column in yesterday’s Wall Street Journal, “How to Fix Our Appalling Tax Code”.  This legislation, developed over the past three years by the committee he chairs, has lots of attractive features.  Mainly, however, it would give the economy a substantial boost.  Congress’s Joint Committee on Taxation estimates that it would increase GDP by $3.4 trillion over the next ten years and create 1.8 million new jobs.
CaptureIt will accomplish this goal by trimming or eliminating tax breaks and loopholes for the wealthy in order to reduce tax rates for almost everyone.  For example, the home mortgage deduction will be cut, for new homeowners, from the current value of $1,000,000 to $500,000.  The deduction for state and local taxes will be eliminated.  The charitable deduction will only apply for contributions in excess of 2% of income.  The middle class is protected by raising the standard deduction to $11,000 per individual or $22,000 per couple.  This means that 95% of taxpayers will be able to avoid itemizing.
The two basic tax rates would be 10% up to $75,000 in income, then 25% up to $400,000.  Over $400,000 there would be a 10% surcharge on salaried or “non-production” income.  The corporate tax rate would be cut from 35% to 25%, again by eliminating special exemptions and loopholes.
All of these features add up to a dramatic simplification of our tax code which will save an estimated $168 billion annually in preparation fees.
But always keep in mind the larger purpose of broad based tax reform like this.  In the words of the economist Glenn Hubbard, it is “a policy shift in favor of mass prosperity – dynamism and inclusion.”  It will do more for the poor than raising the minimum wage because it will actually create new jobs and better paying jobs.
This legislation represents a fantastic starting point for a national discussion on pro-growth tax reform.  Let’s get on with it!

Truth and Myth about Inequality


Two of my favorite columnists are the Brooking Institution’s William Galston, a social economist who has a weekly column in the Wall Street Journal and the economics journalist Robert Samuelson who writes for the Washington Post.  
Most people agree that income inequality in the U.S. is steadily getting worse.  Mr. Galston make a good case (see my last post) that it is primarily caused by the large gap between the rising productivity of American workers and the stagnant level of their pay which has developed since 1973.  He thinks that we need a fundamentally new social contract which links worker compensation to productivity.  This, of course, is a tall order and it is not at all clear how such a new order would be achieved.
CaptureMr. Samuelson has a different perspective: “Myth-making about Economic Inequality”.  For example:

  • The poor are not poor because the rich are rich
  • Most of the poor will not benefit from an increase in the minimum wage because only 6% of the 46 million poor people have full time jobs
  • All income groups have gained in the past three decades, even though the top 1% has gained the most (see the above chart from the CBO, December 2013)
  • Widening economic inequality did not cause the Great Recession

These two perspectives on inequality are quite different but not contradictory.  Basically what Mr. Samuelson is saying is that we have to be careful in how we address this problem or we’ll just make it worse.  Raising taxes on the rich is unlikely to help and might hurt if it slows down the economy.  Raising the minimum wage will only raise a fairly small number of people out of poverty and may cause a lot of unemployment along the way.
My solution: focus on boosting the economy to create more jobs in the short run (tax reform, immigration reform, trade expansion) and improved educational outcomes for the long run (early childhood education, increasing high school graduation rates, better career education).
But I agree with Mr. Galston that it is imperative to lessen income inequality, one way or another.  Otherwise as a society we’ll have big trouble on our hands.

Closing the Productivity and Pay Gap

The social economist William Galston has a column, in last week’s Wall Street Journal, “Closing the Productivity and Pay Gap”, discussing the large gap between the rising productivity of American workers and the stagnant pay level which has developed since 1973 (see below).  He points out that “the erosion of the compensation/productivity link has made it harder to sustain robust domestic demand for goods and services, which constitutes more than two-thirds of our entire economy.  As the gap widened, U.S. households responded by sending more women into the workforce, expanding the numbers of hours worked, and taking on a greater burden of debt.  These strategies have hit a wall.  Unless compensation rises more rapidly, stagnant domestic demand will depress economic growth as far as the eye can see.”  In other words, workers are no longer receiving their fair share of the productivity gains.  And this retards the increased economic growth which we all desire.  Without detracting from the seriousness of Mr. Galston’s argument, I would like to make several observations which are pertinent to the discussion.
CaptureFirst of all, as pointed out by the Heritage Foundation (in the second chart), wage stagnation since 1973 does not take into account the growth of total compensation including healthcare and other benefits.  And since healthcare costs are twice what they are in any other country, this is a huge drag on the growth of worker’s pay.  In other words, if the U.S. were able to cut healthcare costs nearly in half, as should be possible with a more efficient system, then the hundreds of billions of dollars saved would give a huge boost to paychecks.
Capture2Secondly (as shown in the last chart), there is a direct correlation between wages and education level for U.S. workers.  Of course, boosting educational outcomes is much easier said than done and, in any event, is a long term process.  Nevertheless, any highly motivated and ambitious person can increase their earnings prospects by succeeding in school.
Capture1Finally, a combination of minimum wage increases and perhaps an expansion of the Earned Income Tax Credit can help those people at the lowest levels of the income scale earn a living wage as long as they are willing to work.
As Mr. Galston said in an earlier piece, “We need nothing less than a new norm – a revised social contract – that links compensation to productivity.  And because we cannot return to the conditions that once sustained that link, we need new policies to bring it about.”

Poverty, Inequality and the Minimum Wage II. Cities Are Expensive!


Poverty and inequality are getting worse in the United States.  The question is what to do about it.  One proposal is to raise the minimum wage from its current value of $7.25 per hour to $10.10 per hour.  The Congressional Budget Office has studied the tradeoffs in doing this.  Approximately 16 million people, at the bottom end of the wage scale, would see their incomes go up.  But 500,000 people would see their incomes go down because they’d lose their jobs!  Does the positive outweigh the negative?  It’s not clear!
CaptureBut here is another aspect of the problem.  The Brookings Institution has just published a new study “All Cities Are Not Created Unequal”, pointing out that the 50 largest cities in the U.S. have higher rates of inequality than does the country as a whole.  Brookings looks at the so-called 95/20 ratio between the 95th percentile of wage earners compared to the 20th percentile.  The national average for this ratio is 9.1 with the 95th percentile earning (in 2012) $191,770 and the 20th percentile earning $20,968.  But many large cities such as San Francisco (16.6), Boston (15.3) and New York City (13.2) have much higher ratios.  The midsized city of Omaha has a ratio of 8.2 which is below the national average.
In other words the problems of poverty and inequality are much worse in some parts of the country than in others.  This suggests that at least part of the solution to addressing this problem should come at the state and local level.  It makes sense for California, Massachusetts and New York, for example, or at least San Francisco, Boston and New York City, to establish their own higher minimum wages.
This is not to say that a higher minimum wage at the national level is not also needed (more coming).  But the whole country cannot be expected to bail out a few major cities where the problem is much worse than elsewhere.

Poverty, Inequality and the Minimum Wage


Poverty and income inequality are getting increasingly worse in the United States and need to be seriously addressed by our political system.  In my last post on February 16, I presented data from the Heritage Foundation which shows that the War on Poverty has been quite successful in eliminating destitute poverty in the U.S.  What this means is that most low-income families have the basic necessities of enough food to eat (96%), a refrigerator (99%), a telephone (96%), air conditioning (81%), a car (74%), etc.  Of course, these “amenities” are provided at a great cost to society of about $1 trillion per year in social transfer payments.
CaptureCan we do a better job in helping the poor in the near term?  The conservative writer and political activist, Ron Unz, thinks we can.  He has just written a perceptive blog post “The Conservative Case for a Higher Minimum Wage”, proposing a national minimum wage of $12 per hour.  His reasoning is as follows.  Low wage jobs are primarily in the non-tradable service sector and so these jobs are hard to outsource and also hard to automate.  Therefore the unemployment effects of such a minimum wage increase would be minimal.  Mr. Unz estimates that, Walmart could accommodate a $12 per hour minimum wage with a one-time price hike of just 1.1%.  The grocery prices of home-grown agricultural products would rise by less than 2%.
A $12 per hour wage for a full time 40 hour per week worker would mean an annual salary of $25,000 per year or $50,000 per year for a couple.  At this income level, the family would be paying more in taxes and receiving fewer government benefits.  This would turn many net tax recipients into net taxpayers and thereby raise their stakes in the American way of life as well as lowering the deficit.
I emphasize that this is a program to alleviate poverty in the U.S.  It will not do anything to help the middle class worker whose wages have been stagnant ever since the recession started six years ago.  This is a much harder problem which will require politically charged changes in U.S. economic policy.
Stay tuned!

Poverty, Inequality and Mobility in a Free Society: Can We Do Better?

There has been a lot of public attention given to these topics recently.  Our stagnant economy since the end of the recession almost five years ago has meant high levels of unemployment and underemployment which naturally causes widespread discontent.  The 50th anniversary of President Johnson declaring War on Poverty provides an opportunity to look back and evaluate its success.
A very good summary of where we stand on poverty was given two years ago by Robert Rector and Rachel Sheffield of the Heritage Foundation: “Understanding Poverty in the United States: Surprising Facts about America’s Poor”.  The authors used 2010 census data for their study.  Poverty was defined to be a cash income of $22,314 or less for a family of four in 2010 (which increased to $23,550 in 2013).  They pointed out, for example, that “96% of poor parents stated that their children were never hungry at any time during the year because they could not afford food.”  The chart below shows that poor households, in general, have many of the common amenities.
CaptureIn other words, the close to $1 trillion spent per year ($871 billion in 2010) by federal and state governments on means tested assistance for the poor has largely eliminated destitute poverty in the U.S.  Further progress will require successfully addressing both the collapse of marriage and the lack of parental work in low-income communities.  These very difficult problems can only be addressed with a long term educational effort to turn poor children into productive citizens.
Conclusion:  the War on Poverty has had reasonable success at huge cost and further gains will be more expensive and more drawn out over time.  We’ve already started on this second phase by emphasizing early childhood education and so the focus now should be to implement this new direction.
Next step: it’s now time to direct our serious attention to the issues of inequality and mobility.  That will be the subject of my next post!

Inequality, Productivity and Compensation

The Brookings Institution social economist, William Galston, has an interesting column in yesterday’s Wall Street Journal, “The U.S. Needs a New Social Contract”, deploring the fact that worker compensation (i.e. wages + benefits) has not kept up with gains in worker productivity since the 1970s.  Here is a chart published by the Economic Policy Institute showing the divergence between productivity and compensation for a “typical” ( i.e. in the middle) worker beginning in the 1970s:
CaptureThe Heritage Foundation’s James Sherk has addressed this same question in a recent report “Productivity and Compensation: Growing Together” and shows that the “average” compensation of an American worker does track productivity very closely as shown in the chart below:
Capture1What is the explanation for this apparent discrepancy?  In fact, it is the difference between the average earnings of U.S. workers and the earnings of the median or middle worker.  The very high earnings of the top 10% and the even higher earnings of the top 1% raise average worker compensation way above the income level of the median worker.  In other words it is the result of the skewed and unequal distribution of incomes which is heavily weighted toward those at the top of the scale.  The typical or median worker is falling behind and is not benefitting from the steady rise in the overall productivity of the American economy.  This is what income inequality is all about.
The question is what to do about it.  Faster economic growth will create more opportunity by creating more jobs and better paying jobs.  Raising high school graduation rates as well as creating high quality technical training programs will also help.
Mr. Galston insists that this is not enough.  Too many workers will continue to lag farther and farther behind.  We could raise the Earned Income Tax Credit for low income workers but this would be very expensive in our currently tight fiscal situation which is likely to continue indefinitely.
Do we need a new social contract?  If so, what form will it take?  How will we pay for it?  These are indeed very difficult questions to answer!

The Economic Outlook: 2014 – 2024 II. How Can We Grow Faster?

Last week I summarized the latest economic report from the Congressional Budget Office which very clearly describes both the slow rate of growth of our economy since the end of the recession, the enormous buildup of our national debt in the past five years and also the likelihood that it will continue getting worse for the foreseeable future unless big changes are made.
CaptureAbout a week ago the two economists Edward Prescott and Lee Ohanian had an Op Ed in the Wall Street Journal, “U.S. Productivity Growth Has Taken a Dive”, pointing out that the productivity of U.S. workers has grown at an average annual rate of only 1.1% since 2011, much lower than the average annual rate of about 2.5% since 1948 (see the above chart).  They also point out that the rate of new business creation is 28% below where it was in the 1980s (see the chart just below).  Growth of worker productivity and growth of new business formation are the two main forces which drive economic growth.
Capture1“Why is the startup rate so low?  The answer lies in Washington and the policies implemented in the wake of the 2008 financial crisis that were, ironically, intended to grow and stabilize the economy.” Mr. Prescott and Mr. Ohanian continue that it is the “explosion in federal regulation, intervention and subsidies (which) has retarded productivity growth by protecting incumbents at the expense of more efficient producers, including startups.”
It is easy to be pessimistic about the prospects for change in the government policies which are retarding economic growth.  Unfortunately, many political and social leaders have the point of view that it is income inequality which is “the defining issue of our time.”
The best response to this pervasive attitude is to shift the conversation towards equality of opportunity rather than dwelling on income inequality.  By far the best way to increase opportunity for those who desire it and are willing to work for it is to grow the economy faster in order to create more and better jobs. If we are able to do this, we’ll all be much better off.

The Economic Effect of ObamaCare

Last week’s report from the Congressional Budget Office “The Economic Outlook: 2014 – 2024” (which I discussed in my last post) caused a big stir with its prediction that ObamaCare will cause a loss of 2,000,000 mostly low wage jobs by 2017 and 2,500,000 such jobs by 2024.  The lost jobs aren’t necessarily from workers being fired or fewer workers being hired but rather the overall decreased incentive for individuals to find work.  The CBO analysis is based on the research of the economist Casey Mulligan featured in yesterday’s Wall Street Journal as “The Economist Who Exposed ObamaCare”.
CaptureThe above chart of Mr. Mulligan interprets several recent government subsidy programs as a new marginal tax rate, i.e. the “extra taxes paid and government benefits foregone as a result of earning an extra dollar of income.”  The 2009 stimulus, the Recovery and Reinvestment Act, had an effect like this but it was temporary.  The marginal tax increase of the Affordable Care Act will last as long as it remains in effect.
Capture1The above chart from the same CBO report, showing the steady decline in the Labor Force Participation Rate from the year 2000 onward, demonstrates the critical nature of this problem.  Lower labor force participation means lower growth in overall labor productivity which in turn means slower economic growth.  Since the Great Recession ended in June 2009, GDP growth has averaged only about 2% annually.
Slow GDP growth means, in addition to a higher unemployment rate, that America’s standard of living will not increase very rapidly if at all.  But the problem is really much worse than this.  We have an enormous debt problem which is only getting worse every year that we continue to have large deficits.  The CBO report predicts increasing growth in the size of our national debt.  By far the least painful way of shrinking our debt (relative to the size of the economy) is to grow the economy as fast as we reasonably can.  But our economy is actually slowing down, not speeding up!
This is a very serious problem which many of our national leaders are much too complacent about!