The Big Picture on Debt


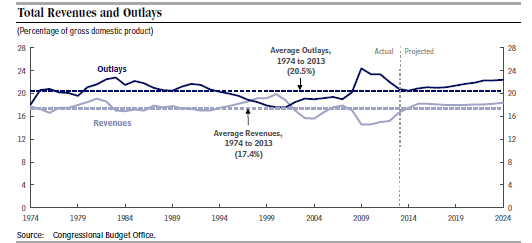
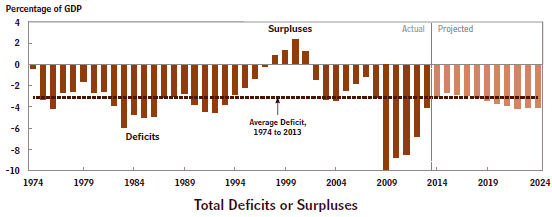
Most observers agree that the Congressional Budget Office is a reliable source for detailed, objective and nonpartisan information about the federal budget.  Its frequent reports are cited by all sides in budget debates.  Today I refer to the recent CBO publication, “The 2014 Long-Term Budget Outlook in 26 Slides.”  In particular, one of its graphs entitled “Federal Debt Held by the Public” (pictured here) has a striking message.
CaptureThroughout history, the U.S. has had relatively large debt following each of its major wars, especially after World War II.  But the debt has always declined relatively quickly, as a percentage of GDP, as the economy recovered and grew briskly. But now, in 2014, we are stuck with a huge debt which is projected (by CBO) to not shrink but rather to keep getting much worse.  And furthermore, the so-called “Extended Baseline Projection” in the graph, is an optimistic projection which disregards several long-term trends such as mortality decline, possibly slower productivity growth, higher interest payments and likely growth of federal healthcare spending.
How in the world will this huge debt problem be resolved in a favorable manner?  Republicans don’t want to raise taxes and Democrats don’t want to cut spending, especially on entitlements.  The only action taken in the last few years, under threat of not lifting the federal debt limit, was to implement a Sequester on discretionary spending.  This helps but not nearly enough.
Recent budget agreements are not auspicious for future progress.  A five year farm bill was passed last spring without significant cuts to either farm subsidies or food stamps.  Highway spending was extended for a few months with a gimmick when what we really need to do is increase the federal gasoline tax.  A $17 billion (over three years) increase for veteran’s health has just been approved when what we really need is an extensive overhaul of the Veterans Administration.
There are deficit hawks in Congress, on both sides of the aisle, but their numbers are too small to be effective.  It is just very hard to vote no on spending measures when the pressure coming from special interest groups on all sides is to vote yes.
I am an eternal optimist by nature but I have a hard time visualizing a favorable outcome to our fiscal dilemma.  I am arranging my own affairs accordingly.

Should We Be Optimistic or Pessimistic about Our Country’s Future?

Last month the Congressional Budget Office issued the report “The Budget and Economic Outlook: 2014 to 2024”, giving an updated prediction on economic performance.  It predicts continued slow growth of GDP leveling off in the next few years at a rate of about 2.2% per year.  The public debt (on which we pay interest) will be 74% of GDP this year and increase to 79% of GDP by 2024.  Federal revenues will grow this year to 17.5% of GDP while federal spending will be 20.5% of GDP.  The problem is that the gap between revenue and spending will get worse as indicated by the chart below.
CaptureCBO estimates that interest rates on three month Treasury bills will rise from 0.1% today to 3.7% in 2018, and higher in subsequent years, which means that interest payments on our public debt will increase dramatically as shown in the chart below.  Inflation is predicted to average about 2% over this time period.  Unemployment will slowly drop to 5.8% in 2017 and not reach 5.5% until 2024.
Capture1In an article two days ago, an economics reporter for the New York Times, Floyd Norris, writes that this is “A Dire Economic Forecast Based on New Assumptions”.  Mr. Floyd argues that it is unlikely that we will continue to have both anemic growth and high interest rates at the same time.  Of course, if the economy does grow more quickly, then government revenues will also grow faster which will slow down the growth of the debt.  But CBO predicts that our recovery from the Great Recession will continue to be tortuously slow.
The problem is that when interest rates do go up, as they will sooner or later, interest payment on the national debt will rise quickly, as shown in the CBO chart.  This is going to happen and will be unpleasant to deal with.  Are we going to have slow growth in the meantime, with high unemployment along with it, and then also have expensive debt payment later?  This is indeed a pessimistic prospect!
We have a continuum of choices:

  • Do nothing until the big crunch hits in a few years (like Greece)
  • Cut spending dramatically, including for entitlements (politically infeasible)
  • Raise taxes dramatically (also politically infeasible)
  • Both cut spending and raise taxes (perhaps doable as we get closer to the big crunch)
  • Grow the economy faster which would both lower unemployment and raise revenue

I know what my choice is, how about you?

The Economic Outlook: 2014 – 2024 I. The Basic Data


The Congressional Budget Office has just issued the report ”The Budget and Economic Outlook: 2014 to 2024”, giving its usual objective and nonpartisan look at our prospects for the next ten years.  My purpose today is to give a simple interpretation of its basic data.  In my next post I will address the implications of this interpretation.
CaptureCapture1The first chart above shows a forty year history of government deficit spending.  The average deficit for this time period is 3% of GDP.  From 1982 – 1987 the deficits were worse than this and from 2009 – 2013 they were much worse.  The real problem is the accumulated deficits, i.e. the debt.  The second chart above shows the public debt (what we pay interest on) all the way back to 1940 as a percent of GDP.  As recently as 2008, the public debt was below 40% of GDP.  Now it is 73% and climbing.  This is very serious for two reasons.  Right now our public debt is almost free money because interest rates are so low.  But when interest rates return to their normal level of about 5%, interest payments will explode and be a huge drain on the economy.  In addition, these CBO predictions assume continued steady growth of the economy.  If and when we have a new recession or some other financial crisis, there will be much less flexibility available for dealing with it.
Capture2Now look at the last two charts.  The first one shows the rate of GDP growth since 2000 which has averaged about 2% since the end of the recession in June 2009 and is projected by the CBO to level off at this same rate over the next 10 years.  This is an historically low rate of growth for our economy. The final chart shows the gradual decrease of the labor force participation rate over this same time period.  These two graphs are related!  When fewer people are working, the economy simply will not grow as fast.
High debt and slow growth are big problems for an economy.  We’re falling more deeply into this perilous state of affairs all the time.  We need to take strong measures to break out of this dangerous trap!

What Is the State of the U.S. Economy?


On the eve of the President’s State of the Union address, the New York Times gives an answer to this question in today’s paper, “Obama’s Puzzle: Economy Rarely Better, Approval Rarely Worse”.  The charts below do show the basic trends all moving in the right direction.  But is this good enough?
CaptureThe unemployment rate is moving steadily downward but it is still a high 6.7% almost five years after the recession ended in June 2009.  And this is with a labor participation rate of only 58.6%, which is historically very low.
The budget deficit is dropping but is still unsustainably high.  In the five years, 2009 – 2013, deficits have totaled $6 trillion dollars.  As soon as interest rates return to their historical average of 5%, interest on this $6 trillion in new debt alone will total $300 billion per year, forever!  Furthermore, the Congressional Budget Office, the most credible source of budget information, predicts that the deficit is likely to resume an inexorable climb within a few years as baby boomers retire in ever greater numbers, rapidly driving up entitlement costs.
Economic growth was stronger than expected in the last quarter of 2013 and this is a good sign.  But it has averaged only about 2% since the recession ended which is very low by historical standards, in a post recessionary period.
The point is, do we really need to settle for such mediocre performance: a stagnant economy, high unemployment and massively accumulating debt?  Should we just declare that in a highly competitive global economy with an ever higher premium on information and technology, that we just can’t do any better than we already are?  Isn’t there some way to make our economy grow faster in order to provide more and higher paying jobs?
I think that the answer to this last question is an emphatic yes!  In fact, this is what my blog is all about.  Just read some of the other recent posts and let me know if you disagree with what I am saying!

More on Inequality: What Does the Data Mean?

In yesterday’s Wall Street Journal, the economist Robert Grady addresses “Obama’s Misguided Obsession With Inequality”.  The basic problem is that an important Congressional Budget Office report in 2011, “ Trends in the Distribution of Household Income Between 1979 and 2007”, is easy to misrepresent and misinterpret.  Here are three basic pieces of data from the CBO report:
Capture3CaptureCapture1The first chart shows that yes, between 1979 and 2007 the rich did indeed get richer relative to the rest of the population.  The second chart shows, however, that median household income increased by 62% during this same time period.  And the third chart shows that all five income groups made substantial gains at the same time.
As Mr. Grady says, “Here is the bottom line.  In periods of high economic growth, such as the 1980s and 1990s, the vast majority of Americans gain and have the opportunity to gain.  In periods of slow growth, such as the past four and a half years since the recession officially ended, poor people and the middle class are hurt the most, and opportunity is curbed. … The point is this: If the goal is to deliver higher incomes and a better standard of living for the majority of Americans, then generating economic growth – not income inequality or the redistribution of wealth – is the defining challenge of our time.”
So then, what is the best way to address income inequality?  Should we concentrate on raising taxes on the rich and increasing spending on social programs like we have done in the last five years?  Or should we rather concentrate on speeding up economic growth, as Mr. Grady says, in order to create more jobs and more opportunities for advancement?
Compare the enormous growth in the period from 1979 to 2007 with the stagnation of the past five years.  Isn’t it obvious which is the better way to proceed?

The Floundering of America


In yesterday’s Wall Street Journal, columnist William Galston talks about “The Floundering of America”.  Based on recent reports from the Congressional Budget Office, Mr. Galston says that “Today we are hurtling toward a less dynamic economy, a meaner society and a riskier world.”
His argument is based on these observations:

  • For the past 40 years, 1970-2010, the labor force expanded at an average rate of 1.6% per year.  It will soon slow to only .4% annual growth, because of more retirements and a plateauing of women’s labor-force participation. This means that growth in GDP will slow down to about 2% annually from its historical average of over 3%.
  • America is aging very fast.  Today there are 57 million Social Security beneficiaries which will increase to 76 million in 2023.  Obviously this will rapidly increase entitlement spending on retirees.
  • America already spends 18% of GDP on healthcare costs and the CBO projects that this will grow to 22% by 2038.

“In sum, current trends and policies will yield lower rates of economic growth, painfully slow gains in real incomes, huge increases in outlays for expenses related to an aging population, and a health sector that devours more and more of the national product”, he says.
These trends are all contributing to an explosion of the national debt.  The only current strategy to keep this debt even roughly stable during the next decade, let alone reduce it, is to shrink discretionary spending through sequestration.  This will lead to a decline in discretionary spending to 5.3% of GDP by 2023.  This means roughly 2.6% of GDP for national defense with an equal share or all other domestic purposes.
“This is pure folly”, says Mr. Galston. “The country needs a new national strategy for a viable future.”
How do we achieve a new strategy?  Immigration reform will increase the size of the workforce.  Tax reform could boost the economy by encouraging business expansion, risk taking and entrepreneurship.  True (consumer-driven) healthcare reform could dramatically lower the cost of healthcare.  In other words there are potential policies out there that address our national floundering. We simply need leaders who are capable of going beyond partisanship in order to help create a better future!

Nowhere to Cut? II. Are You Really Trying?

The New York Times has a story today, “A Dirty Secret Lurks in the Struggle Over a Fiscal ‘Grand Bargain’”, suggesting that there are really two reasons why the House-Senate Budget Conference Committee, chaired by Representative Paul Ryan and Senator Patty Murray, is unlikely to accomplish very much.  The simple reason is that the Republicans will not support tax increases, on which the Democrats insist, and the Democrats will not support major changes to entitlement programs, on which the Republicans insist.
But the “dirty secret” (according to the NYT) is that Republicans don’t really want to trim either Social Security or Medicare, which many Tea Partiers receive, and Democrats don’t really want to raise taxes on the upper income individuals who support them.  Furthermore, the deficit for 2013 was “only” $680 billion, and is expected to drop further in the next few years, while interest rates are so low that borrowing hundreds of billions of dollars each year is not expensive.  In other words, just kick the can down the road.  Let somebody else worry about the problem in the future.
My previous post “Nowhere to Cut”, based on the report from the Congressional Budget Office, “Options for Reducing the Deficit: 2014 – 2023”, picks 14 possible budget cuts or revenue enhancements out of a total of 103 such items listed.  Just these 14 items alone amount to a savings of $566 billion over ten years, more than enough to offset half of the entire sequester amount.
For example, raising the eligibility age for Medicare to 67 would save $23 billion (over 10 years), using the ‘chained’ CPI to measure inflation for all mandatory programs would save $162 billion, tightening eligibility for food stamps would save $50 billion, taxing carried interest as ordinary income would save $17 billion, limiting highway funding to expected highway revenues would save $65 billion, reducing the size of the federal workforce through attrition would save $43 billion, limiting medical malpractice torts would save $57 billion, and modifying Tricare fees for working-age military retirees would save $71 billion.  Just these eight savings total $456 billion and would offset almost half of the entire sequester.
What is so difficult about making a tradeoff deal like this?  Isn’t this what we send people to Washington to do?

Nowhere to Cut?

After five years of enormous deficits, our national debt now stands at over $17 trillion.  The only spending restraint that Congress has been able to achieve so far is an approximately one trillion dollar “sequester” over ten years, therefore amounting to about $100 billion per year in spending cuts.  Federal expenditures have actually dropped for two years in a row now so the sequester really does work.  Of course, almost everyone complains about cutting spending in such a “dumb” way.  Why not make intelligent budget cuts by eliminating the least effective programs instead of having to make small percentage cuts in all discretionary spending, good and bad alike?  Well, this really should not be all that difficult to do if Congress would try a little harder.
The Congressional Budget Office has just released a helpful report, “Options for Reducing the Deficit:  2014 to 2023”, which lists 103 ways for either decreasing spending or increasing revenues over the next decade.  Amazingly, enacting all of these proposals would amount to a budget savings of $13 trillion over 10 years, ten times what is required by the sequester!  Here are some examples of what could be done (along with the 10 year savings):

  • Eliminate direct payments to agricultural producers                             $25 billion
  • Increase federal insurance premiums for private pensions                    $5 billion
  • Reduce the amounts of federal pensions                                               $6 billion
  • Tighten eligibility for food stamps                                                          $50 billion
  • Use more accurate measure of inflation for all mandatory programs  $162 billion
  • Replace some military personnel with civilian employees                     $19 billion
  • Limit highway funding to expected highway revenues                           $65 billion
  • Eliminate grants to large and medium sized airports                               $8 billion
  • Eliminate subsidies for Amtrak                                                               $15 billion
  • Reduce the size of the federal workforce through attrition                     $43 billion
  • Tax carried interest as ordinary income                                                 $17 billion
  • Limit medical malpractice torts                                                               $57 billion
  • Raise the age of eligibility for Medicare to 67                                         $23 billion
  • Modify Tricare fees for working-age military retirees                              $71 billion
  • Total                                                                                                      $566 billion

Right here is more than enough to offset half of the sequester.  You don’t like these cuts?  Then replace them with others from the CBO report.  There are lots of options to choose from!

Is It Mean Spirited to Cut Food Stamps?

In yesterday’s Wall Street Journal, columnist William Galston writes “In Defense of Food Stamps” that “food stamps reach their intended targets, poor and near-poor Americans. The large increase in the program’s cost over the past decade mostly reflects worsening economic conditions rather than looser eligibility standards.  Since 2000 the number of individuals in poverty has risen to 46.5 million from 31.6 million.”
Mr. Galston also states that “the number of able-bodied adults without dependents receiving benefits under the food stamp program has risen to nearly 5.5 million from under 2 million since 2008 even as work requirements for those individuals have been relaxed.  Here the critics have a case: the federal government should reconsider the waivers of current requirements it has extended to 44 states and the District of Columbia and it should consider toughening those standards.”
Congressional Republicans have proposed cutting $40 billion from the food stamp program over 10 years, or $4 billion per year.  Since the total food stamp budget is $80 billion per year, this amounts to a 5% cut.  And this 5% cut is directed precisely at those 5.5 million able-bodied adults without dependents.  Expecting these people to find a job, even if minimum wage, in return for receiving food stamps, is not asking too much.  It is really just “tough love” more than anything else.
Putting a substantial portion of these 5.5 million able bodied adults back to work would also be a big boost to the economy.  One of the biggest drags on the economy at the present time is the low labor participation rate which has dropped from about 66% to 63% since the recession began in 2008-2009.
Trying to make the food stamp program more cost effective is really just an example of what should be done across all programs of the federal government, routinely, as a matter of sound operating procedures.  It is unfortunate that ideology and political partisanship get in the way of such common sense!

A Pessimistic View of America’s Future III. What, Me Worry?


This week’s cover story in Barron’s, by Gene Epstein, “What, Me Worry?”, attempts to create more attention for our impending fiscal crisis.  “Stop all the dithering, D.C.  The baby-boom budget bomb could destroy the economy within 25 years.  The time to act is now.”  As Mr. Epstein says:

  • Obamacare is part of the problem but so are Medicaid, Medicare and Social Security.
  • The latest budget report from the Congressional Budget Office, published on September 17, makes an “optimistic” forecast that the federal debt will grow to 100% of GDP by 2038 from an already high 73% today.
  • But its more realistic forecast is a debt of 190% of GDP by 2038, worse than the current debt of Greece, which has a 27% unemployment rate.

“By 2038 there will be 79.1 million U.S. residents 65 and older, up from 44.7 million today.  The working age population, 18 to 64, will grow at a much slower rate, to 214.7 million from 197.8 million today.  As a result the dependency ratio will plummet to 2.7 working age people to support each senior in 2038, from 4.4 today.”
“Since the elderly population won’t begin to reach critical mass until the mid-2020’s, the rising tide of red ink will be relatively modest over the next ten years.”
“The nation thus might be likened to a family with about 10 good working years left which needs to cut spending in order to save for a rapidly approaching old age.  But alas, it’s a dysfunctional family incapable of rational planning.”
Today we have the option of simply containing the growth of entitlement spending.  If we don’t act now, tomorrow we will be forced to make deep cuts in entitlement spending.  Today we have the option of making intelligent cuts in discretionary spending.  Tomorrow we’ll be forced to make drastic cuts across the board which will make the slowdown in the economy due to the budget sequester “look like a Sunday afternoon walk in the park” (Bill Clinton, May 2013).
What does it take to knock common sense into our national leaders?