Can Omaha Avoid Having Its Own “Ferguson”?


As racial tensions begin to ease in Ferguson MO, it is natural to inquire about the root causes of this turmoil and how to avoid future recurrences.  Of course, police brutality and public distrust were the triggering events and need to be thoroughly investigated by the proper authorities.
Capture
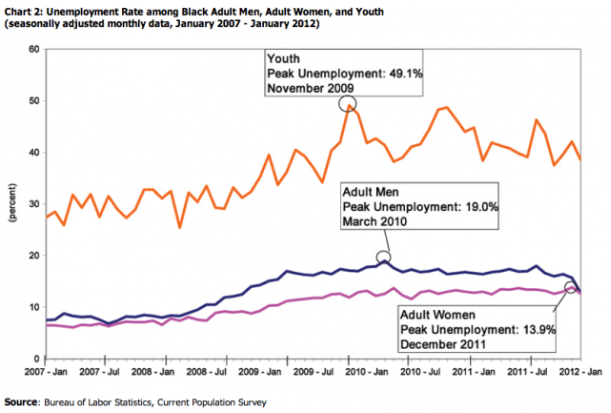
But the problem goes deeper than this.  The above chart from Think Progress  demonstrates the very high unemployment rate among black teenagers.  Is it surprising that idle teenagers get into trouble?
Omaha NE, where I live, is not immune to these problems.  In 2011 Nebraska had the worst black homicide rate in the nation at 34.4 per 100,000 population, just ahead of Missouri with a rate of 33.4.  Black unemployment in Omaha is estimated to be 20% compared with Omaha’s overall unemployment rate of 3.8%.
The problem goes still deeper yet.  To be employable, black youths need to become educated, i.e. to stay in school and remain on track to graduate.  This, in turn, means that they need to succeed in school from the very beginning, for example, by being proficient in reading at the end of third grade.
My last post, “Responsibility Goes Along With the “Good Life,” describes steps that are now getting under way in Omaha to turn around this whole vicious downward spiral of destructive black teenage behavior.  The Buffett Early Childhood Institute has put together a long range plan to work with children in poverty from birth to age eight to make sure that they are prepared to succeed in school. It is funded by an annual property tax levy of $5 per $100,000 of assessed valuation throughout the two county metropolitan Omaha area.  With such a local funding source, the program will inevitably receive much public attention.
Nebraska is aware that not all of its residents share in the “Good Life” and is making a conscious effort to find its own solution for a very serious national problem.

Responsibility Goes Along With the “Good Life”


The New York Times recently compiled a map rating each of the 3,135 counties in the U.S. according to the following six factors:  educational attainment, median household income, unemployment rate, disability rate, life expectancy and obesity.  As can be seen (below) the whole state of Nebraska (motto: the Good Life) comes out very well in this rating scheme.
CaptureOn the other hand, Omaha has the highest black child poverty rate in the country at 59.4% (Omaha World Herald (4/15/2007)).  Partly for this reason the Nebraska Legislature established the Learning Community of Douglas and Sarpy Counties in 2008 whose purpose is to close the academic achievement gap between middle class and low-income students in the Omaha metro area.
Just a few days ago the Learning Community Coordinating Council approved an early childhood education plan developed by the Superintendents of the 11 Omaha area school districts to help children in poverty in the metro area.  It will cost about $2.5 million per year and will fund 29.5 full-time equivalent positions.  The plan will be managed by the newly established Buffett Early Childhood Institute in Omaha.  The increase in the property tax throughout the two county area to support this program will amount to $5 per year for the owner of a $100,000 house.
It is quite appropriate for an overall wealthy community like Omaha in a very well off state like Nebraska to pitch in, in this way, to help out its less fortunate residents.  It represents an example of how state and local governments can and should step in and take more responsibility for addressing their own problems without help from the federal government which is broke and needs to cut back on what it does.
If the Early Childhood Education plan lives up to its high expectations (as I believe it will), it is likely to receive much national attention and will become a model for other parts of the country.  Nebraskans should be proud of supporting such a forward looking initiative!

Barack Obama vs Paul Ryan: Who Is Moving Us in the Right Direction?


“If you give a man a fish you feed him for a day.  If you teach a man to fish you feed him for a lifetime.”
Chinese Proverb

Several weeks ago my post, “How to Improve America’s Welfare System,” described a new proposal from the House Budget Committee (Chair, Paul Ryan) to let selected states experiment in consolidating separate federal programs such as SNAP, TANF, child-care and housing assistance programs, into a new composite Opportunity Grant Program.  The idea is to let participating states choose qualified providers who would then be held accountable for moving people off of assistance, out of poverty and into productive employment.
CaptureA recent report from the Tax Foundation compares what families pay in taxes with what they receive in government benefits.  In 2010, 60% of American families (with incomes up to $86,000) received more in federal benefits than they paid in federal taxes.  However in 2012, this percentage grew to 70% (those families with incomes up to $109,000).  In other words, the trend under Obama is for more people to be net receivers of benefits than net payers of taxes. There are two basic problems with this trend towards more and more benefits for more and more people:

  • As it stands right now, we’re making people more dependent on government programs. Instead we should be helping them become more independent and more capable of supporting themselves on their own. This would improve their quality of life.
  • Our federal government is spending way too much money and not collecting enough tax revenue to pay the bills. According to report after report from the Congressional Budget Office, the trajectory of growing debt is getting much worse and the problem will become harder and harder to rectify as we continue down this path.

My natural inclination is to be optimistic that our political process will respond to this bleak current path we’re on and that things will be turned around before we have another financial crisis.  But it is easy to imagine a course of events where this does not happen.
It’s clear what we need to do but how will this get done?


The Big Picture on Debt Part IV The Full Model


For the past week I have been discussing different aspects of our alarming debt problem as vividly illustrated in a recent report from the Congressional Budget Office  (see chart below).  My last post discusses what I call the Buffett Model:  G > D, meaning that as long as nominal growth G (real growth plus inflation) is greater than the deficit D, then the accumulated debt will decrease as a percentage of GDP and the debt is said to be “stabilized”.  This, of course, is what has happened in the U.S. historically after all of our major wars and especially after WWII (see below).  The problem is that our current situation in 2014 appears much bleaker going forward because the debt is projected (by CBO) to just keep on growing indefinitely.
CaptureToday I look at a broader model, the so-called BRITS model:  R + I > (S – T) + B   where

  • B = borrowing costs
  • R = real growth
  • I = inflation
  • T = taxes
  • S = spending.

The BRITS model reduces to the Buffett model by letting G = R + I and D = (S – T) + B.  The value of this more general model is to show the relationship between all five of these important variables.  To meet the objective of stabilizing debt, according to this intuitive model, we should increase both R and I and decrease S – T and B.
The Federal Reserve is involved by keeping B as low as possible and making sure that I is large enough (but not too large or other problems will occur).  Congress can help by cutting spending or raising taxes but, of course, both of these actions are hard to do politically.
If real growth R is high enough then the desired inequality will hold and debt will be stabilized.  But how is this accomplished?  The Fed has been trying to increase growth through quantitative easing but it’s not working very well.  Many economists think that it would be more helpful for Congress to implement broad based tax reform, whereby tax rates are lowered and loopholes and deductions are closed in a revenue neutral manner so that overall tax revenue remains the same.  But nobody wants to lose their own deductions so this is hard to do.
CaptureAs much as faster growth will help, it is still critical for Congress to get spending under control.  The above chart from the Heritage Foundation shows that under current trends by 2030 federal spending will have increased so much that all federal tax revenue will be spent on just entitlements and interest payments alone!  Since this is unrealistic, some sort of a major new crisis is likely to occur before 2030!
Conclusion: The BRITS model helps to understand the complexity of our debt problem and some of the steps that need to be taken to alleviate it.  I will return to it in the future.

The Big Picture on Debt Part III. The Oracle of Omaha Speaks


“I could end the deficit in 5 minutes.  You just pass a law that says anytime there is a deficit of more than 3% of GDP, all sitting members of Congress are ineligible for re-election.”                                                                                                                                                                       Warren Buffett, 1930 –

Mr. Buffett made this quip in a recent interview with CNBC.  Since the economy has historically grown at a rate of about 3%, Mr. Buffett is saying that we’ll be alright as long as economic growth exceeds deficit spending.  This is generally correct but, as Mr. Buffett well knows, the situation is more complicated than this.
CaptureA very good, and nontechnical, discussion of this whole subject can be found in the newly published book, “The Death of Money: the coming collapse of the international monetary system” by the financier James Rickards.  Look at Chapter 7, “Debt, Deficits and the Dollar.”
Simplifying Mr. Rickards’ approach a little bit, and keeping it in Mr. Buffett’s framework, for a stable economy we need to have
G > D
where the nominal growth G = real GDP + I (I is the rate of inflation) and the deficit D = S – T  (S is spending and T is tax revenue).  I have included interest paid on the debt as part of total spending.  As long as the left hand side is greater than the right hand side, the economy is growing faster than the deficit and the accumulated debt will shrink as a percentage of GDP. Notice that the rate of inflation affects the left hand side of the inequality while the interest rate is part of the right hand side.
Negative inflation is deflation which is clearly undesirable.  The Federal Reserve’s current target for inflation is 2%.  The challenge for the Fed is 1) to keep inflation high enough and interest rates low enough so that G > D, while at the same time, 2) to make sure that inflation does not grow so high as to destabilize the markets.
Given our underperforming economy with low real GDP growth, and huge deficits, Mr. Rickards is pessimistic that the Fed can continue successfully “in the position of a tightrope walker with no net … exuding confidence while having no idea whether its policies will work or when they might end.”
Thus the gloomy title for his book.

The Big Picture on Debt II. Why It Is So Alarming


My last post, “The Big Picture on Debt,” used a chart from a recent Congressional Budget Office report (pictured  below) to look at the history of U.S. debt.  It is worse now than at any other time except at the end of World War II.  But after 1945 massive military spending ended rapidly, the economy started growing briskly and debt as a percentage of GDP shrunk rapidly.
CaptureThe light purple section at the right hand side of the chart portrays CBO’s debt projection for the next 25 years.  As the report itself makes clear, CBO is using favorable economic assumptions in this projection.  Without these favorable assumptions, our future debt will be much worse than this.  And the same trends continue indefinitely into the future beyond the 25 year window.
Right now our huge debt is almost “free” money because interest rates are so low.  But this situation cannot last much longer without setting off an inflationary spiral.  As interest rates eventually resume their historical average of about 5%, interest payments on our accumulated debt will skyrocket and therefore increase the size of the annual deficits.
There are only three ways to shrink debt as a percentage of GDP: 1) cut spending, 2) achieve faster growth and 3) raise tax revenue.  Let’s look at each in turn:

  • Government spending as a percentage of GDP is not shrinking but actually growing. Primarily this is because of the massive growth of the big three entitlement programs: Social Security, Medicare and Medicaid. All other government spending is subject to Sequester limits. This is a crude and insufficient way to control discretionary spending.
  • GDP growth, averaging 2.2% annually since the end of the Great Recession five years ago, is much slower than the overall average growth of 3.3% since the end of WW II. Major tax reform at both the individual and corporate levels, with lower tax rates offset by closing loopholes and shrinking deductions, would give a big boost to economic growth. But there is resistance to cutting tax deductions.
  • Raising taxes will in principle decrease deficit spending but the trick is to do it without hurting economic growth. Both individual and corporate tax reform could accomplish this if done in the right way. See here and here for specific proposals.

Conclusion:  there are concrete ways to find solutions to get our massive accumulation of debt under control and shrinking as a percentage of GDP.  But the prospects for action are gloomy.

The Big Picture on Debt


Most observers agree that the Congressional Budget Office is a reliable source for detailed, objective and nonpartisan information about the federal budget.  Its frequent reports are cited by all sides in budget debates.  Today I refer to the recent CBO publication, “The 2014 Long-Term Budget Outlook in 26 Slides.”  In particular, one of its graphs entitled “Federal Debt Held by the Public” (pictured here) has a striking message.
CaptureThroughout history, the U.S. has had relatively large debt following each of its major wars, especially after World War II.  But the debt has always declined relatively quickly, as a percentage of GDP, as the economy recovered and grew briskly. But now, in 2014, we are stuck with a huge debt which is projected (by CBO) to not shrink but rather to keep getting much worse.  And furthermore, the so-called “Extended Baseline Projection” in the graph, is an optimistic projection which disregards several long-term trends such as mortality decline, possibly slower productivity growth, higher interest payments and likely growth of federal healthcare spending.
How in the world will this huge debt problem be resolved in a favorable manner?  Republicans don’t want to raise taxes and Democrats don’t want to cut spending, especially on entitlements.  The only action taken in the last few years, under threat of not lifting the federal debt limit, was to implement a Sequester on discretionary spending.  This helps but not nearly enough.
Recent budget agreements are not auspicious for future progress.  A five year farm bill was passed last spring without significant cuts to either farm subsidies or food stamps.  Highway spending was extended for a few months with a gimmick when what we really need to do is increase the federal gasoline tax.  A $17 billion (over three years) increase for veteran’s health has just been approved when what we really need is an extensive overhaul of the Veterans Administration.
There are deficit hawks in Congress, on both sides of the aisle, but their numbers are too small to be effective.  It is just very hard to vote no on spending measures when the pressure coming from special interest groups on all sides is to vote yes.
I am an eternal optimist by nature but I have a hard time visualizing a favorable outcome to our fiscal dilemma.  I am arranging my own affairs accordingly.

Five Sectors to Blame for Economic Weakness


Several of my recent blog posts have addressed various issues relating to our slow growing economy.  In particular I have proposed a simple way to speed up economic growth: namely, broad-based tax reform at both the individual and corporate levels.  The idea is to lower tax rates across the board, paid for by closing loopholes and shrinking deductions.  At the individual level this could have the effect of putting as much as $250 billion per year in the hands of the middle and lower income wage earners who will surely spend most of it, thereby giving the economy a big boost.  The U.S. corporate tax rate is not internationally competitive.
In today’s New York Times the economics writer, Neil Irwin, has an article “Why Is the Economy Still Weak?  Blame These Five Sectors.”  The five sectors are, in order of magnitude of effect: housing, state and local governments, durable goods consumption, business equipment investment, and federal government.  See the chart below.
CaptureLet’s look in turn at each of these top five barriers to faster economic growth:

  • Housing. Not at all surprising with 24 million people either unemployed or underemployed. Young people especially cannot afford to buy their first home today.
  • State and Local Governments. These governmental units have to balance their budgets. When people have more money to spend, tax revenues will increase and so will public spending.
  • Durable Goods Consumption. These same 24 million people aren’t buying much new furniture or many new cars either. It makes complete sense.
  • Business Equipment Investment.  Lower corporate tax rates will incentivize our multinational firms to bring their foreign profits back home for reinvestment.
  • Federal Government. Unfortunately nothing can be done about this category! Federal deficit spending is way too high as it is and must come down.

Conclusion:  Using broad-based tax reform to put a large amount of money in the hands of middle and lower-income wage earners, and also reforming corporate taxes, will boost spending for four of the five main barriers to faster economic growth.  Why don’t we do it?

How to Increase Growth and Decrease Inequality at the Same Time II. A Concrete Example


The United States has two fundamental economic and fiscal problems at the present time.  First of all, the economy is growing too slowly to create enough new jobs.  In fact, there are now 24 million people either unemployed or underemployed.  Secondly, federal tax revenue is not sufficient to pay the bills.  Of course, these problems are interrelated.  If the economy were growing faster, more tax revenue would be generated and deficit spending would be lower.
CaptureAt the same time, changes in society, such as globalization and technological progress, are creating higher levels of inequality.  Economic inequality is inevitable in a free society but too much of it will create resentment.  The best way to minimize such resentment is to make sure that incomes are rising for all.  In other words, first speed up growth.  If inequality can also be reduced, so much the better.
A few days ago my post “How to Increase Growth and Decrease Inequality at the Same Time!” presented such a plan.  The idea is to enact broad-based tax reform, whereby tax rates are lowered for everyone, offset by shrinking tax deductions.  The 64% of taxpayers who do not itemize deductions will receive a big tax cut.  Since they are the lower and middleclass wage earners with stagnant incomes, they will tend to spend their tax savings, thereby giving the economy a boost.  But this means that the 36% of (wealthier) taxpayers who do itemize deductions will, on average, end up paying higher taxes.  Overall, this represents a shift from the wealthy to the less wealthy and therefore lessens inequality.
Here is a concrete example to illustrate the magnitude of what can be accomplished:

  • Individual tax deductions total about $1 trillion per year.
  • Let’s suppose that these deductions are cut in half to $500 billion per year.
  • Let’s further suppose that half of this amount, or $250 billion per year, is cut from the taxes of the 64% who do not itemize deductions.
  • If these 64% spend just 2/3 of their new income (instead of saving it or paying off debt), this will total $170 billion which is 1% of GDP.
  • This would increase the rate of growth of GDP from the 2.2% average, since the end of the Great Recession, to 3.2%. This represents an enormous boost to the economy and would return average GDP growth to about its 3.3% average since 1947.

I emphasize that this is an oversimplified illustrative example to demonstrate what can be achieved with a plan of this nature.  Hopefully it will be more thoroughly analyzed by an expert economist, which I am not!

How to Increase Growth and Decrease Inequality at the Same Time!


The Department of Commerce has just reported basic economic data for the second quarter of 2014.  As the chart below shows, the economy gradually lost steam from 2004 – 2008, sunk badly in 2008 and 2009, and has now grown at a slow but steady rate of about 2% during the period 2010 – 2014.
CaptureOne of my favorite journalists, the New York Times’ economics reporter Eduardo Porter, has just written again on the topic of inequality, “Income Inequality and the Ills behind It.”  He quotes the economist Tyler Cowen as saying “The right moral question is ‘are poor people rising to a higher standard of living?’  Inequality itself is the wrong thing to look at.  The real problem is slow growth.”  The economist Gregory Mankiw is quoted as saying that “Policies which address the symptom (of inequality) rather than the cause include higher taxes and a more generous safety net.  The magnitude of what we can plausibly do with these policy tools is small compared to the size of the growing income gap.”
What Mr. Cowen and Mr. Mankiw are both suggesting is that we can’t effectively attack income inequality without also increasing economic growth.  I believe that it is possible to address both problems at the same time by implementing broad-based tax reform as follows:

  • Individual income tax rates should be lowered across the board, paid for by closing loopholes and shrinking deductions, in a revenue neutral way.
  • The 64% of all taxpayers who do not itemize deductions will get a significant tax cut. Since they are largely the middle and lower-income wage earners with stagnant incomes, they will tend to spend their tax savings, thereby giving the economy a big boost.
  • At the same time the 36% of taxpayers who do itemize their deductions will, on average, see their income taxes go up. But these are, on the whole, the wealthier wage earners who can afford to pay higher taxes.
  • A plan such as this represents a shift of net after-tax income from more wealthy people to the less wealthy. It therefore reduces income inequality.

If we can cut tax rates, increase economic growth and reduce income inequality all at once, why can’t our national leaders come together and act along these lines?