The Slow Growth Economy We’re Stuck In


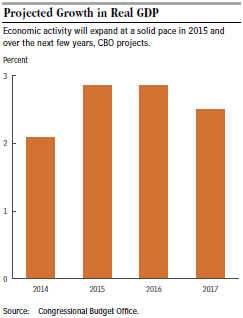
We have very high debt and Paul Krugman says in “Debt Is Good” that we need more! The Congressional Budget Office’s latest report this week, “An Update to the Budget and Economic Outlook: 2015 – 2025” predicts slow economic growth for the next ten years, averaging 2.1% per year (see chart below).
Capture
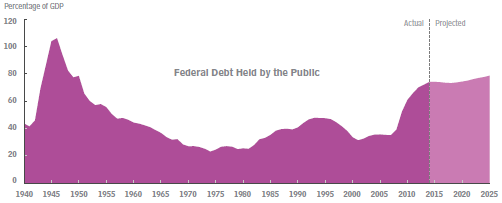
Unfortunately, high debt and slow growth are a deadly, self-reinforcing, combination. Today’s Wall Street Journal has a chart (pictured below) showing clearly how budget deficits are likely to increase over the next ten years. The public debt (on which we pay interest) is predicted to grow from 74% of GDP today to 77% of GDP in 2025, increasing by a total of $7 trillion over this time period.
Capture1Here is another connection between slow growth and high debt:

  • Slow Growth means higher than necessary unemployment and under-employment as well as minimal raises for employed workers. The resulting economic slack leads to
  • Low Inflation. But low inflation means that the Federal Reserve can maintain
  • Low Interest Rates to try to encourage more borrowing to stimulate the economy. This means, in turn, that Congress can run up huge deficits without having to pay much interest on this almost “free” money. This eventually leads to:
  • Massive Debt. But what happens when inflation does take off, which has happened before and is likely to happen again? Then the Federal Reserve is forced to raise interest rates quickly and we are stuck with huge interest payments on our accumulated debt. And meanwhile entitlement spending on Social Security, Medicare and Medicaid is also growing rapidly. At this point debt increases very rapidly which leads to a severe
  • Fiscal Crisis.

Of course things don’t have to happen like this. Congress might become more responsible and either cut spending and/or raise taxes and start shrinking our huge deficits. Or perhaps slow growth really is the new normal and interest rates will remain low indefinitely. But slow growth is not pain free; there are many millions of unemployed and under-employed Americans who want to work and whose lives are stunted otherwise.
Slow growth is a very destructive path to be following. We badly need to adopt policies to speed it up!

Paul Krugman: “Debt Is Good”


Every Monday and Friday morning when I pick up the New York Times, I immediately turn to the OP-ED page to see what liberal icon Paul Krugman is saying. In his most recent column, “Debt Is Good,” he says that “what ails the world economy right now is that governments aren’t deep enough in debt.”
CaptureHere is my response to his argument:

  • “The federal government can (now) borrow at historically low interest rates. So this is a very good time to be borrowing and investing in the future.” Our public debt (on which we pay interest) is now $13 trillion or 74% of GDP, the highest since the end of WWII, as shown in the above chart from the Congressional Budget Office. It is likely that interest rates will soon begin to go up. Every 1% rise will increase interest payments on our already existing debt by $130 billion per year. Where are the hundreds of billions of new dollars for debt service going to come from in an already tight budget? The more we add to the debt, the worse this problem will become.
  • “Having at least some government debt helps the economy function better.” I agree! But $13 trillion is way beyond what is needed for this. It is outrageously excessive!
  • “What we need are policies that would permit higher (interest) rates in good times without causing a slump. And one such policy would be targeting a higher level of debt.” The problem here is the conceit of Keynesians, like Mr. Krugman, that monetary policy alone can restore us to economic and fiscal health. Rather than accepting that the economy has entered a “new normal” with a permanently slow growth rate of about 2% (as has been the case since the end of the Great Recession in June 2009), we need policy changes such as individual and corporate tax reform (revenue neutral to be sure) and changes in the Affordable Care Act and Dodd-Frank Act to remove their job killing features.


Anybody with an ounce of common sense knows that excessive borrowing will eventually lead to disaster. Mr. Krugman seems to think that by constantly ridiculing his opponents, he can get away with denying this simple truth.

Could the U.S. End Up Like Greece? II. How Long Will It Take?


My last blog post, “Could the U.S. End Up Like Greece?” compares Greece’s present fiscal situation (public debt at 180% of GDP) with our own current fiscal situation (public debt at 74% of GDP and rising fast).  The Congressional Budget Office predicts that, under current policy, the U.S. debt will not reach 180% until about 2055, forty years from now.  One could (wrongly!) conclude from this that we are okay for the time being.
CaptureHowever, this is not true!  The Peter G. Peterson Foundation has taken a closer look at the most recent CBO report.  Under a less optimistic, but more realistic, Alternative Fiscal Scenario, the U.S. debt will reach 175% in 2040.  The Alternative Fiscal Scenario assumes, for example, that:

  • About 50 expiring tax breaks will continue to be extended year by year, as they were in 2014 and have been repeatedly in the past. These “tax extenders” increase the deficit by over $40 billion per year.
  • Discretionary spending will soon rise back up to its historical share of GDP. In other words, the sequester, which is currently holding down the growth of discretionary spending, may be overridden or at least relaxed.

Greece, with its debt at 180% of GDP, is only being required by the European Central Bank to pay 1.7% interest on this debt indefinitely into the future.  Thanks to the low interest rate policy of the Federal Reserve, 1.7% is also the current rate of interest being paid on the U.S. debt.  But this historically low interest rate is unlikely to continue much longer without setting off a much higher rate of inflation.
In other words, we’ll likely be in the same situation as Greece is currently, in much less than 25 years.  Furthermore, Germany and the other EU countries have been keeping Greece afloat for years and may continue to do so.
Who is going to bail us out when we get to where Greece is now?  China?  Unlikely.  We’ll be on our own and it won’t be pretty!

Life in America: Opportunity or Inequality?


How bad is income inequality in the U.S. and what should be done about it?  This is a question of great current interest with many different points of view.  The chart just below from the Congressional Budget Office shows the extent of income inequality and also shows that it has gotten somewhat worse between 1979 and 2007, just before the onset of the Great Recession.  And we know that our stagnant economy has made it worse yet between 2007 and the present.
CaptureBut now look at the chart (below) from the U.S. Census Bureau of the distribution of household income in the U.S. in 2012.  The chart shows the median income of about $51,000 and then has a very long tail to the right.  This means that there are large numbers of households making large incomes of all different sizes.  It makes no particular sense to distinguish the top 1% (who make $380,000 or more) from the bottom 99%.
Capture1The point is that there is huge opportunity in the U.S. to do very well financially whether or not one makes it into the top 1%.
In an earlier post, “Growth vs Equitable Growth,” I reported on the agenda of the Washington Center for Equitable Growth, a progressive think tank.  In order to achieve “equitable growth” they advocate:

  • Improving educational outcomes at all levels, pre-K – 12+.
  • Running a “high pressure” economy in order to tighten the labor market.
  • Expand the Earned Income Tax Credit especially for workers without children.

I couldn’t agree more.  This is an excellent plan to create more prosperity for more people.  It’s much more plausible in the U.S. to make poor people richer than to make rich people poorer.

The Fiscal Time Bomb Is Still Ticking!


The Congressional Budget Office is by far the most objective source of detailed information about the federal budget, playing a valuable role in the super-charged political atmosphere of Washington D.C.  It has just released a new annual report, “The 2015 Long-Term Budget Outlook,” projecting our fiscal health for the 25 year window, 2015-2040, based on current policy. It is a scary scenario indeed.
CaptureAs shown in the above chart, our public debt (on which we pay interest) has increased from 38% of GDP at the beginning of the Great Recession in 2008 to 74% today.  Although it will remain steady at this high level for about five years, it will then resume a steady increase, reaching a level of about 100% of GDP by 2040.
As many observers, including myself, have pointed out, when interest rates eventually return to their normal historical level of around 5%, interest payments on this huge, and rapidly increasing, debt will double or triple from their current low level, causing a very painful budget shortfall.
Simple prudence suggests that the only responsible course of action is to put our debt on a downward path, as a percentage of GDP, in order to minimize this looming problem to the greatest possible extent.
Capture1CBO gives some useful guidelines for what is required to do this:

  • Just to keep the debt at its current value of 74% of GDP by 2040 would require an annual 6% increase in revenue or a 5½% decrease in spending. This would amount, for example, to a $210 billion spending cut for 2016.
  • To reduce the debt to 38% of GDP by 2040, its average over the past 50 years, would require an annual 14% increase in revenues or a 13% decrease in spending. The spending cut for 2016 would be $480 billion.

These examples show the enormity of the fiscal mess we have gotten ourselves into.  Under current policy it will require a big effort just to stay even with where we are right now, without showing any debt reduction over the next 25 years!
Our only hope is to change current policy.  But how?

A Lull in the Storm


The Congressional Budget Office has a sterling reputation for collecting accurate data and making credible predictions about basic economic and fiscal trends.  CBO analyses, which are based on current law, are generally accepted as valid by both liberals and conservatives.  Considering the degree of hyper-partisanship in most discussions of fundamental policy, it is reassuring to at least have an unimpeachable source of basic information.
CaptureCBO has just released its regular annual report, ”The Budget and Economic Outlook: 2015-2025.” There is good news for the near term.  As shown above, GDP is projected to grow by 2.9% in the (budget) years 2015 and 2016, and dropping to 2.5% growth in 2017, which is still better than 2014. This means that our national debt will not grow from its current level of 74% of GDP for the next few years and might even decrease slightly.
Capture1Growth will then hover around 2.2% for the remainder of the 2015 – 2025 decade, which is the average GDP since the end of the Great Recession in June 2009.  Likewise, unemployment will likely not fall much below its current value of 5.6% for the next ten years.  In short, under current policy, except for the next couple of years, we are stuck in the same slow-growth rut where we have been for the past five and one-half years.
It should be obvious that we need new policies to speed up growth, put more people back to work, and raise the stagnant wages endured by many middle- and lower-income workers.  How can this be accomplished?

  • Tax reform, both individual and corporate, is the primary route to faster growth. Lower tax rates across the board, paid for by closing loopholes and shrinking deductions. This will put extra income in the pockets of the 64% of taxpayers who do not itemize deductions, which they will likely spend. It will also make it easier for potential entrepreneurs to successfully launch a new business.
  • Immigration reform, expanded foreign trade and deregulation will also create more business opportunities which will in turn grow the economy and create more jobs.

Hopefully the new Congress will be able to move forward in this direction.  A better future depends on it!


Where Should the New 114th Congress Focus Its Attention?


The two main themes of this website are how to boost economic growth and how to get our national debt under control.  Faster economic growth will put more people back to work by creating more jobs.  Faster growth will also bring in more tax revenue and therefore potentially reduce deficit spending.
The latest monthly unemployment rate, 5.8% for November 2014, is much higher than it should be almost six years after the end of the Great Recession in June 2009.  The best thing that Congress could do to boost economic growth is to adopt broad-based tax reform, lowering tax rates in a revenue neutral way by closing loopholes and limiting deductions.  I’m still in favor of doing this but I no longer consider it to be the top priority for the following reason.
The huge drop in the price of gasoline is already providing a big economic stimulus.  At the current price of $2 per gallon, the average American family will save about $750 per year in driving expenses.  This is even more relief than a tax cut would provide.  The economy has already picked up steam in 2014 and is predicted to grow at the rate of 3% in 2015.  This will keep the unemployment rate decreasing steadily throughout 2015 and beyond, which represents much progress.
Capture1It’s now time for Congress to focus more strongly on putting the debt on a downward path.  This can only be done by shrinking our annual budget deficits well below the $483 billion deficit for the last (2014) budget year.  As the above chart from Fix the Debt shows, our current fiscal path leads inexorably to a growing debt which is completely unsustainable in the long run.  Annual deficits will have to be at least cut in half to be able to turn the debt trajectory downwards.
Getting this done will require much dedication and hard work by Congress.  Many programs will have to be eliminated.  Surviving programs will need to operate more efficiently.  The entitlement programs of Social Security, Medicare and Medicaid will have to be greatly tightened up.
Is Congress up to this task?  The future of our country depends on it!

Is It Feasible to Cut Tax Preferences to Pay for Lower Tax Rates?


I have been focusing lately on America’s two biggest fiscal and economic problems:

  • How to boost the economy in order to put more people back to work
  • How to either cut spending or raise revenue in order to shrink the deficit.

A few days ago in “The Great Wage Slowdown and How to Fix It,” I laid out a fairly specific proposal to make a substantial reduction in tax preferences in order to cut tax rates across the board and especially for the 64% of taxpayers who do not itemize deductions.  These are the middle- and lower-income workers with stagnant incomes who would likely spend any tax savings they received thereby giving the economy a big boost. Let’s examine whether or not this is a realistic course of action.
CaptureThe above chart from the Congressional Budget Office document, “The Distribution of Major Tax Expenditures in the Individual Income Tax System,” shows that, for example, the upper 10% of households by income receive about 40% of the total $1 trillion in individual tax expenditures per year.  Furthermore, this same top 10% of tax payers have an income of about $140,000 or more (Congressional Research Service). My basic idea is to shrink tax preferences by $250 billion per year and to lower tax rates for middle- and lower-income non-itemizers by this same amount.  If we assume that they would spend 2/3 of this new income, it would boost the economy by $170 billion per year which is 1% of GDP.
A reasonable way to achieve this savings is to expect higher income earners to contribute a greater percentage of their tax preference savings.  For example:

  • top 1% contribute $110 billion (2/3 of their total deductions).
  • top 96th % to 99th % contribute $50 billion (1/2 of their total deductions).
  • top 91st % to 95th % contribute $30 billion (1/3 of their total deductions).
  • top 81st % to 90th % contribute $30 billion (1/4 of their total deductions).
  • top 61st % to 80th % contribute $30 billion (1/5 of their total deductions).
  • this gives a total of $250 billion in tax preference savings.

This back-of-the-envelope calculation is not intended to be definitive but rather to suggest what can be done along these lines.  Those who are more well-off need to make bigger sacrifices in getting our economy back on track.

Barack Obama vs Paul Ryan: Who Is Moving Us in the Right Direction?


“If you give a man a fish you feed him for a day.  If you teach a man to fish you feed him for a lifetime.”
Chinese Proverb

Several weeks ago my post, “How to Improve America’s Welfare System,” described a new proposal from the House Budget Committee (Chair, Paul Ryan) to let selected states experiment in consolidating separate federal programs such as SNAP, TANF, child-care and housing assistance programs, into a new composite Opportunity Grant Program.  The idea is to let participating states choose qualified providers who would then be held accountable for moving people off of assistance, out of poverty and into productive employment.
CaptureA recent report from the Tax Foundation compares what families pay in taxes with what they receive in government benefits.  In 2010, 60% of American families (with incomes up to $86,000) received more in federal benefits than they paid in federal taxes.  However in 2012, this percentage grew to 70% (those families with incomes up to $109,000).  In other words, the trend under Obama is for more people to be net receivers of benefits than net payers of taxes. There are two basic problems with this trend towards more and more benefits for more and more people:

  • As it stands right now, we’re making people more dependent on government programs. Instead we should be helping them become more independent and more capable of supporting themselves on their own. This would improve their quality of life.
  • Our federal government is spending way too much money and not collecting enough tax revenue to pay the bills. According to report after report from the Congressional Budget Office, the trajectory of growing debt is getting much worse and the problem will become harder and harder to rectify as we continue down this path.

My natural inclination is to be optimistic that our political process will respond to this bleak current path we’re on and that things will be turned around before we have another financial crisis.  But it is easy to imagine a course of events where this does not happen.
It’s clear what we need to do but how will this get done?


The Big Picture on Debt II. Why It Is So Alarming


My last post, “The Big Picture on Debt,” used a chart from a recent Congressional Budget Office report (pictured  below) to look at the history of U.S. debt.  It is worse now than at any other time except at the end of World War II.  But after 1945 massive military spending ended rapidly, the economy started growing briskly and debt as a percentage of GDP shrunk rapidly.
CaptureThe light purple section at the right hand side of the chart portrays CBO’s debt projection for the next 25 years.  As the report itself makes clear, CBO is using favorable economic assumptions in this projection.  Without these favorable assumptions, our future debt will be much worse than this.  And the same trends continue indefinitely into the future beyond the 25 year window.
Right now our huge debt is almost “free” money because interest rates are so low.  But this situation cannot last much longer without setting off an inflationary spiral.  As interest rates eventually resume their historical average of about 5%, interest payments on our accumulated debt will skyrocket and therefore increase the size of the annual deficits.
There are only three ways to shrink debt as a percentage of GDP: 1) cut spending, 2) achieve faster growth and 3) raise tax revenue.  Let’s look at each in turn:

  • Government spending as a percentage of GDP is not shrinking but actually growing. Primarily this is because of the massive growth of the big three entitlement programs: Social Security, Medicare and Medicaid. All other government spending is subject to Sequester limits. This is a crude and insufficient way to control discretionary spending.
  • GDP growth, averaging 2.2% annually since the end of the Great Recession five years ago, is much slower than the overall average growth of 3.3% since the end of WW II. Major tax reform at both the individual and corporate levels, with lower tax rates offset by closing loopholes and shrinking deductions, would give a big boost to economic growth. But there is resistance to cutting tax deductions.
  • Raising taxes will in principle decrease deficit spending but the trick is to do it without hurting economic growth. Both individual and corporate tax reform could accomplish this if done in the right way. See here and here for specific proposals.

Conclusion:  there are concrete ways to find solutions to get our massive accumulation of debt under control and shrinking as a percentage of GDP.  But the prospects for action are gloomy.